Bitcoin Heading Down to 5450-5750 Support Zone!
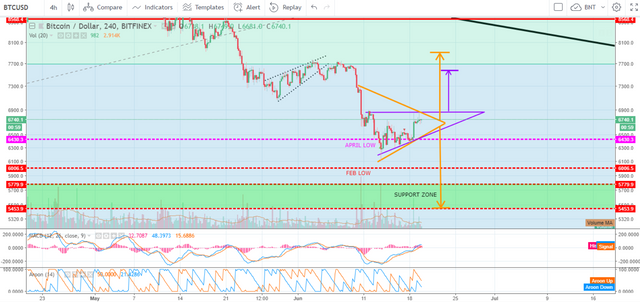
If you read my previous analysis then you would have seen that I identified a symmetrical triangle pattern that would potentially send us down. Well as it turns out; we didn’t see the confirmed break to the downside we were looking for and the crisis was averted! Or was it…
We now find ourselves with two potential triangle patterns at play which could take us either way.
The first pattern is the larger orange symmetrical triangle bearish continuation pattern. This pattern really wants to take us down into the green support zone between around 5450 and 5800ish. On the flip side however, a confirmed break to the upside could see us go as high as 7900 based on the height of the triangle. I think this is unlikely however; as symmetrical triangles are usually continuation patterns and seeing as though we are in a downtrend, then it would more than likely want to see us go lower.
The second pattern is the smaller purple bullish ascending triangle. This pattern wants to send us up to around 7580ish. It’s a real battle of the bulls vs bears going on here! But who will win?
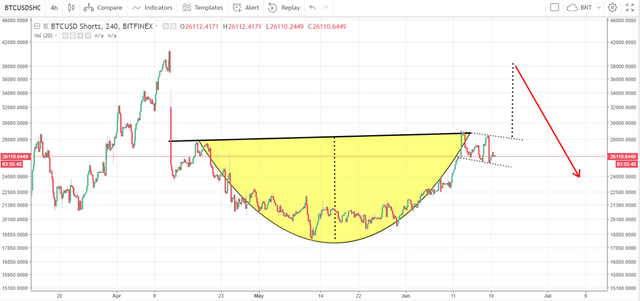
Well taking into consideration BTC shorts – some people are saying the cup and handle formation failed; however I disagree. I think the handle is still forming so there is a pretty good chance that we fall down through the orange symmetrical triangle and get shorted all the way to the bottom of the green support zone (fuelled by the BTCUSDSHORTS Cup and Handle Pattern).
Either way, for now we do not trade and we wait for a confirmed breakout either side of either triangle before determining our next move.

