Bitcoin vs USD - Heading Further Down to 5800-6000ish Support Zone
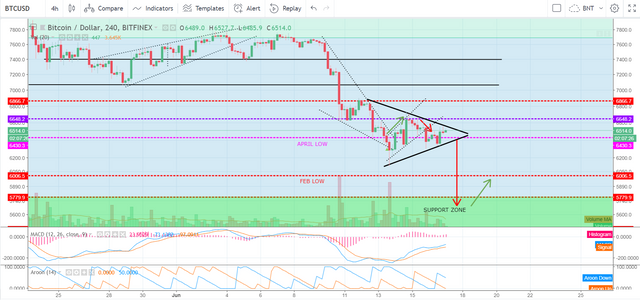
As you can see we recently broke (as expected) to the upside of the falling wedge and then to the downside of the ascending wedge. We now find ourselves trading within a symmetrical triangle pattern. Given these are a continuation pattern and we find ourselves in a clear downtrend; a break to the downside based on the height of the symmetrical triangle -
will likely send us to the support zone between around 5450 and 5800. This would represent a great buy zone.
 !
!
It's also worth noting that shorts are decreasing; albeit longs are haven't really increased. This tells me that the shorters are scared after recently being rekt and nobody is prepared to go long. A LOT of indecisiveness in the market at the moment and low volume; so this symmetrical triangle will fail unless we see increased volume with a break to the downside to confirm its validity.
BTCUSDSHORTS:
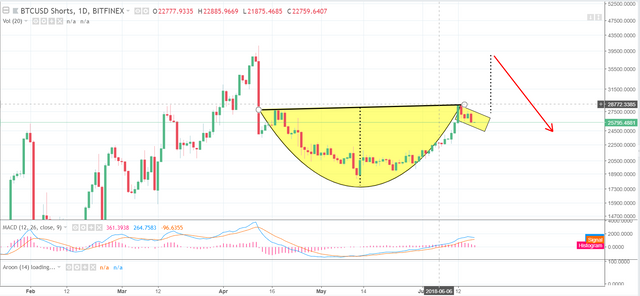
I should also add that if this pattern plays out, then any shorters will need to be careful. As per the cup and handle pattern that would emerge on the BTCUSDSHORTS chart the increase in shorts would be pretty fast and parabolic. This combined with a lot of buyers waiting in the support zone for such a drop; would see us bounce back up just as fast. In such a scenario the Feb low might not even provide any resistance and we could see ourselves returning to around the same zone we are currently in. This could be the start of a bull run as I imagine we would have found our ultimate market bottom. Though, that being said; it is not uncommon for one last test of the market bottom to occur before the bull run emerges. This is all hypothetical of course, and first we must wait and see if we confirm a break to the downside of the symmetrical triangle.