Chainlink from $14.2 till now ($20) and next? multi timeframe analysis
I have posted about #LINK since it was $14, bought at $14.242 (spot, swap on my wallet, not with leverage and not in any broker account and I recommend only this way!)
here is why I bought (which paid me off nicely), and what would I do from now:
the weekly timeframe:
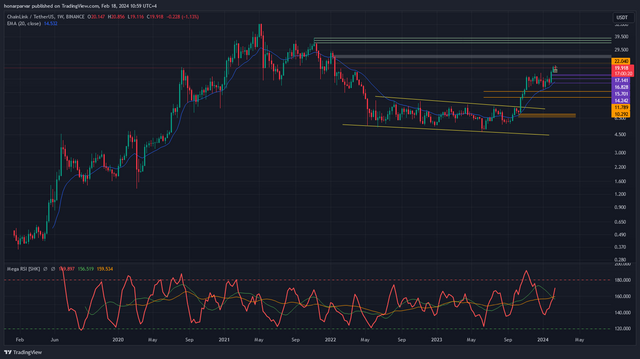
a sharp rise (OCT 2023 til NOV '23) after a long downtrend correction (May '22 till OCT '23) ended in another correction. on the candle starting 15th Jan 2024, there was a bullish divergence with 9 Oct 2023 dip.
to get confirmation on this divergence, let's check daily chart. next candle was ranged between $13.5 and $15.9 which I bought @14.242
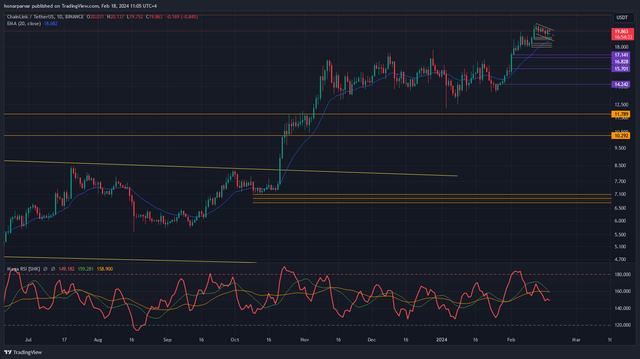
on daily chart, there is a hidden bullish divergence with 25th Jan's dip. I entered next day.
what now?
so far this position is almost 40% in profit. I believe a correction is on the way. $21-$22 can be a pick before the correction starts. the correction can be price wise (touching below demand levels like $17 or time-wise.
I will sell half my position on the first bearish divergence in 1 or 4 hour chart and will buy again if I see a confirmed daily bullish div.
why I don't sell all my position? because on the weekly basis, I still believe the bullrun continues :)
important:
this is not financial advise.
I don't use leveraged positions, leveraged tokens, future, CFD etc on crypto.
I do not use brokers and centralized exchanges like binance kraken etc. I only swap on my wallet.