XMRUSD analysis: Perfect Growth Potential!
Updated XMRUSD trading forecast
Should you buy Monero now and what is the best price to buy?
In this post I applied the following tools: fundamental analysis, candlestick patterns, all-round market view, oscillators, volume profile, graphic analysis, trendline analysis.
Dear friends,
I go on my series of cryptocurrency price forecasts. Today, I’d like to analyze the situation for XMRUSD.
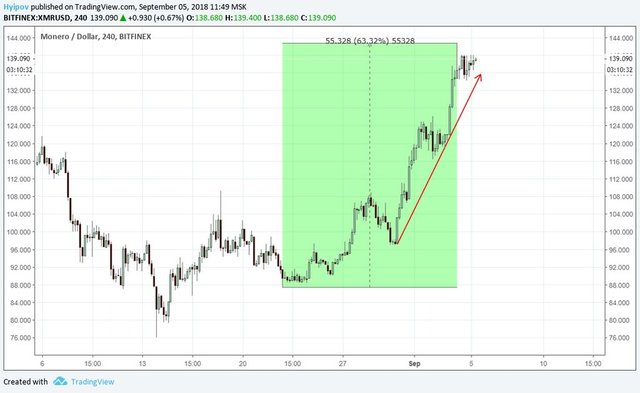
Monero has featured the most impressive growth during the last two weeks. You see in Monero/Dollar chart that it has been about 63% up/
What are the reasons for such a price surge of XMRUSD and should we buy it now? I’ll try to find out below.
Monero fundamental analysis
One of the main reasons for Monero price growth, which I’ve managed to find, is the report by a little-known company, SATIS GROUP on the crypto market prospects for the next few years, published by Bloomberg (the original report is here).
It is clear from the Monero price chart above, that the upward momentum started exactly on August 30, the date of the report publication.
The coin was also supported by some additional hype, when Forbes electronic edition dated August 31 wrote about that report, and gave a brief summary of it. Finally, the news bit triggered a kind of the chain reaction and lots of crypto media stated discussing this message.
To give more detail, the reason for the price rise was conclusion by SATIS GROUP consulting analysts that Monero has the strongest growth potential among altcoins, projecting its price to hit 18.500 USD in 2023.
Remember that Monero now costs 240 USD per coin. If they are right, the coin is to increase by 132 times in the near future.
Suggesting such high evaluation, analysts, first of all, are based on the systematic regulators’ pressure on the cryptocurrency market and their attempts to make it legal and transparent. Therefore, any action will be followed by a counter action, and it will result in a very high demand for the privacy-based cryptocurrencies.
To be fair, I must say that report has affected not only Monero.
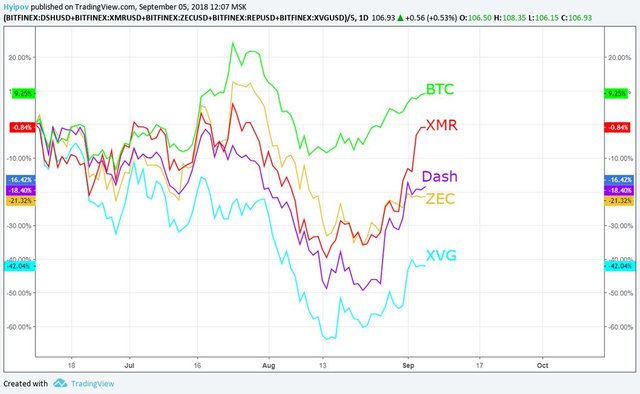
All confidential coins were going up faster than the rest of the market (it is clear in the chart above).
Monero technical analysis
To find out whether we should expect Monero price correction or jump into the rocket right now, let’s study the XMRUSD all-round market view.
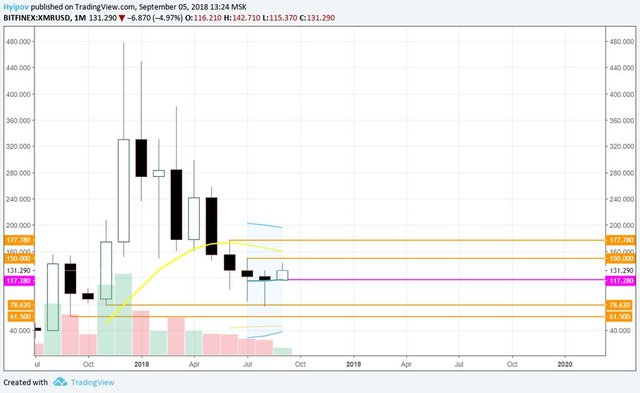
As it is clear from Monero to Dollar price chart above, the monthly timeframe shows that the ticker tested the support at the low of November 2017, but it hasn’t broken it through, proving its importance.
Finally, the price rebounded rather high; it is shown in the monthly candle by a very long wick. THE candlestick itself looks like a bullish hammer; and, the most important, the recent Monero rise in early September has broken out the important resistance level, the previous monthly high.
Now, provided that the ticker at least remains at the current levels or doesn’t drop lower than the previous lows during September, the month will be closed with a bullish signal.
Unfortunately, the nearest upward target is rather close, the ticker will hit the July’s high at 150 USD, and the June’s high is at 177 USD.
As two strong resistance levels are rather close to each other, the ticker won’t be rising so fast if it continues to climb up. The further way up will be much harder, hindered by the price corrections and random signals.
In case of a correction, the strong support level will be Keltner channel’s centre line that is now at 117.8 USD.
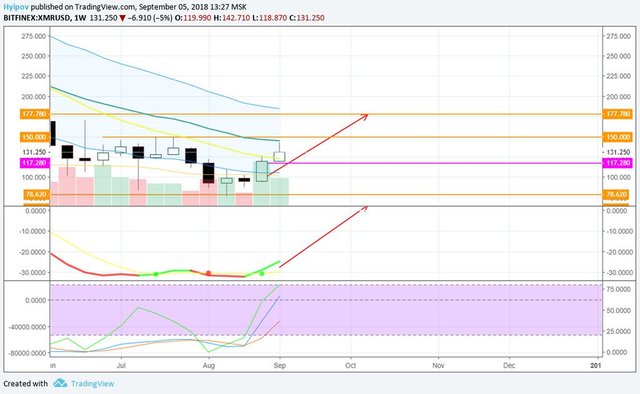
It is clear in the XMRUSD weekly chart above that the ticker rebounded from the weekly moving average of Keltner channel at 143 USD. Moreover, MACD oscillators and RSI stochastic are sending buy signals.
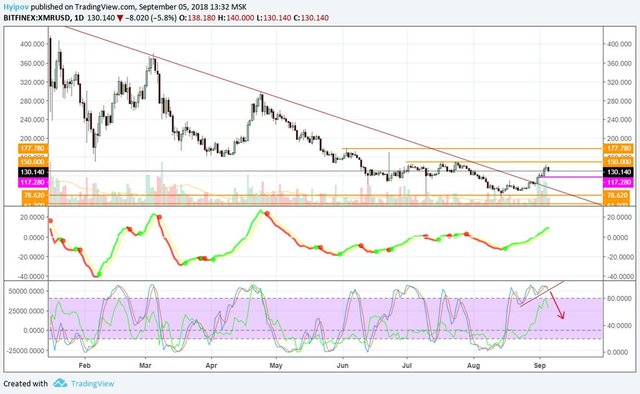
In the Monero daily chart above, you see that the ticker has broken through the bearish trendline, which started in January; it alone is very strong bullish signal.
However, it is clear from the RSI stochastic window that there is strong accumulation in the overbought zone, which may suggest an approaching bearish correction.

As usual, I’ll analyze the four-hour charts as a part of my experiment.
In the left chart, the ticker has broken out the local bullish channel and went down in the correction. MACD also suggest the correction development.
However, in the right chart, MACD and the Kagi chart itself completely confirm the bullish trend. Moreover, the nearest Waist is at 118.24 USD. Therefore, any swings higher than this level won’t be the trend reversal signals and should be seen as just the price swings in the bullish correction.
To sum up my Monero price forecast
Obviously, the analysts’ report has made its effect and focused investors’ attention on the privacy-based cryptocurrencies. It may fundamentally transform the cryptocurrency market situation in the near future, so that the coins that have never been privacy-based will launch the forks with a much higher level of confidentiality.
As for Monero, despite the positive projections for 5-year scope, you shouldn’t forget that this altcoin features extremely strong volatility.
Now, Monero price is being corrected after its sharp surge. It is likely to hit level 118 USD very soon. The next support level is at 108 USD. In general, this dynamics matches to the reversal pattern of the equilateral triangle. The price can exit the triangle in early October already; but, according to its logic, the Monero price will hardly climb higher than 143 USD during September.
That is my XMRUSD trading scenario. Go on following the cryptocurrency rates and staying informed on the cryptocurrency market. I hope my crypto price predictions are useful for you!
I wish you good luck and good profits!
Regards,
Mikhail @Hyipov by liteforex.com
