You are viewing a single comment's thread from:
RE: Congratulations! You are about to survive the longest bear market in Bitcoin's history!
I looked at the bear market of 2014/5 and compared toady's bear phase and it looks like we have a little while longer to go. However, I have seen graphs and stats that say for each new cycle it takes proportionally longer for bitcoin to complete a cycle. So the next coming bull run may not match the past cycle but may take longer than ever before, based purely on the nature of bitcoin and not on any fundamentals or news or events. I'm no expert, these are just graphs I've seen by others.
Is that completely true? Each cycle has taken longer? Looking at the charts with a quick glance it doesn't appear that is the case... at least not going back to the very first bull/bear markets.
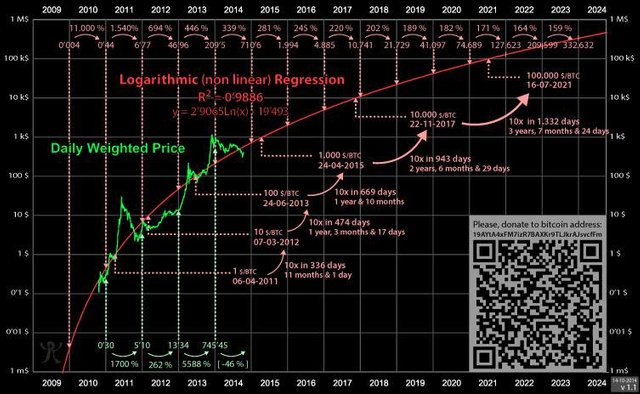
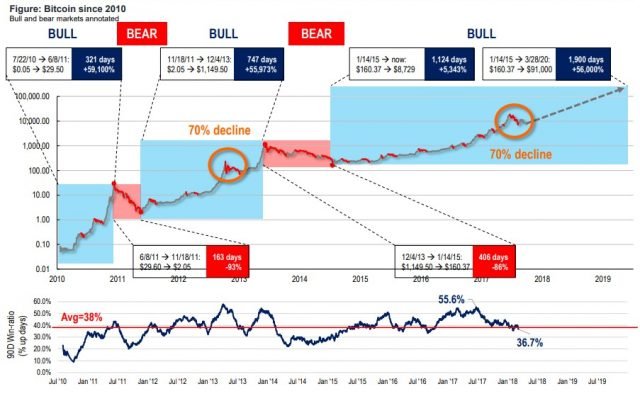
Hi there, @jrcornel, I respect your experience in the market and am keen to learn from your experience. I found these charts referring to bitcoin's price cycles. Can you perhaps give an opinion on them?
![Bitcoin price prediction log graph til 2024.jpg] )
)
(
![Crypto bull bear phases graph.jpg] )
)
(
They are really old charts, no?
Good point, they are quite old, though the second one shows price up to Q2 2018, and shows how each cycle in bitcoin gets longer and longer.
I guess it all depends on what you define a "cycle" as. In this case it looks as though there has only been 3 cycles in Bitcoin's history according to the charts. I see about 6 or so, but that is just me. :)
Aha, I understand, thanks for clarifying that.