WEEKLY REVIEW OF THE TOP 5 CRYPTOCURRENCIES 21st May 2019

Fundstrat Global Advisors co-founder Tom Lee believes that the bear market in Bitcoin has ended. He arrived at this conclusion after monitoring 13 signs that suggest the crypto winter is over.
On the other hand, analysts at JPMorgan Chase opined that after the current rally, Bitcoin is trading above its intrinsic value. They said the recent surge was similar to the end-2017 rally.
However, we believe that comparing the two is incorrect. The surge in end-2017 happened after a long uptrend and there was euphoria all around. However, the current rally has happened after an extended and crushing bear market. And even after the rally, the price is still well below its lifetime highs.
In another development, the US SEC said that it has delayed its decision on the Bitcoin ETF application by VanEck. We like the way the price of Bitcoin has not reacted either to hacking or to the SEC decision in the past few days. This shows that the increase is the price is based on improving fundamentals. So, is this a good time to buy or will the price correct and offer better buying opportunities. Let’s find out.
LEARN HOW TO TRADE CRYPTOCURRENCY WITH A MASTER CRYPTO TRADER!
BTC/USD
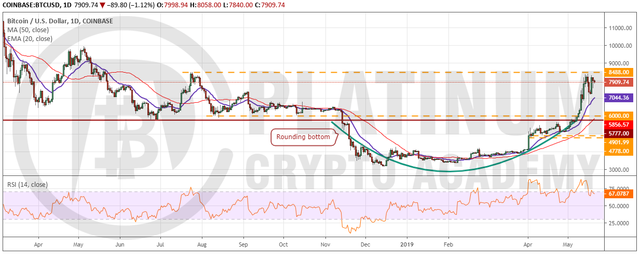
Bitcoin rebounded sharply from the 20-day EMA on May 17. But the pullback is facing resistance at the overhead resistance of $8,488. The trend remains bullish as both the moving averages are sloping up and the RSI is close to the overbought zone. But after the sharp rally of the past few days, the virtual currency might remain range bound for a few days.
This view will be invalidated if the bulls propel the cryptocurrency above $8,488. In such a case, a rally to the next overhead resistance of $10,000 is probable.
On the other hand, if the bears sink the digital currency below the 20-day EMA, it can plummet to the next support at $6,000. This is a critical level to watch on the downside. If this level breaks, it will hurt sentiment and can result in a sharp fall. But if it holds, it might act as a higher base.
ETH/USD
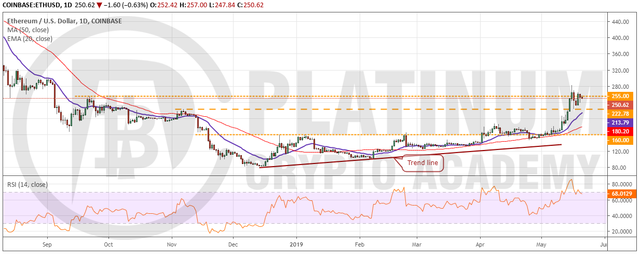
Ethereum easily broke above $222.78 on May 15 and reached $281.77 on May 16. But the bulls could not sustain the higher levels as profit booking resulted in a dip to $222.88 where buying emerged. The cryptocurrency might consolidate between $222.78 and $255 for a few days.
The trend, however, remains bullish as both the moving averages are sloping up and the RSI is close to the overbought zone. If the price sustains above $255, the bulls will again try to propel the digital currency above $281.77. If successful, a move to the stiff resistance zone of $300-$322 is probable. We don’t expect this zone to be crossed easily.
Our bullish view will be invalidated if the bears sink the price below $222.78. In such a case, a drop to the 50-day SMA is possible. Traders who own long positions on our earlier recommendation can book 50% profits on their position at the current levels and trail the stops on the rest at $222. Let’s protect our paper profits.
XRP/USD
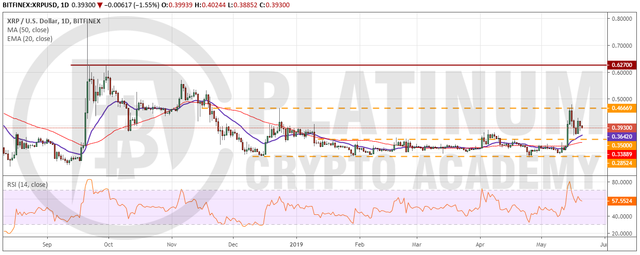
The rally from the lows carried XRP to the overhead resistance of $0.46669. However, we had suggested in our previous analysis to avoid chasing the price higher and wait for a retest to establish long positions. The cryptocurrency dipped close to $0.36 between May 17-19, which provided an opportunity to go long.
However, the bounce has been unable to reach the overhead resistance of $0.46669. The digital currency might remain range bound for a few days before attempting to rise above $0.46669 once again. If successful, a rally to $0.6270 is probable.
Our bullish view will be invalidated if the bears sink the digital currency below the 50-day SMA. In such a case, a retest of $0.28524 is likely. If this support also gives way, the cryptocurrency can drop to the yearly lows. Therefore, traders can keep an initial stop loss of $0.28. We shall raise the stop loss at the first available opportunity.
BCH/USD
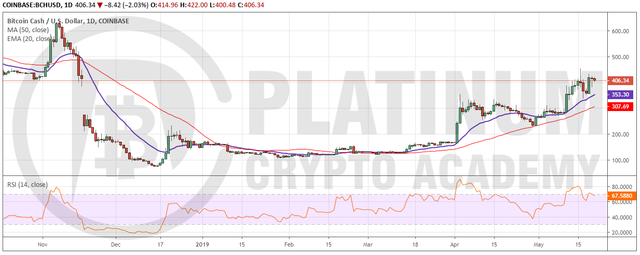
Bitcoin cash is in an uptrend. Both the moving averages are sloping up and the RSI is close to the overbought zone. This suggests that the bulls have the upper hand. The digital currency scaled our first target objective of $414.59 but hit a roadblock just above $450 levels.
The dip found buying support at the 20-day EMA, which is a positive sign. This shows demand at lower levels. The bulls will again try to push the price towards the next target of $497.19 and if that is crossed, a rally to $638.55 is probable.
On the other hand, if the cryptocurrency breaks down of the 50-day SMA, it will lose momentum and can result in a fall to $227.4. We do not find any reliable buy setup at the current levels; hence, we are not recommending a trade in it.
EOS/USD
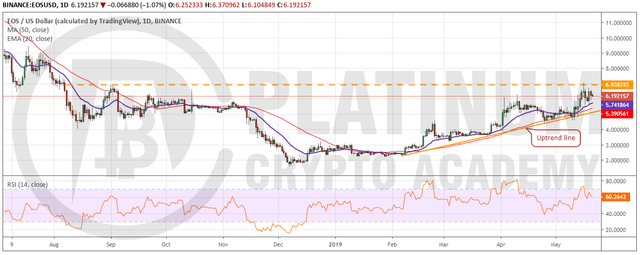
EOS reached the overhead resistance of $6.938393 on May 16 but could not cross it. The resulting dip found support at the 20-day EMA. Since then, the price has been consolidating between the 20-day EMA and $6.938393. This is a positive sign
Both the moving averages are gradually sloping up and the RSI is in the positive zone. This suggests that the bulls are at an advantage. A breakout of the overhead resistance is likely to push the price to $9.
Conversely, if the bears sink the price below the 20-day EMA, it can correct to the 50-day SMA. A breakdown of the uptrend line will weaken the momentum and turn the trend in favor of the bears. We shall wait for the price to sustain above $6.938393 before suggesting a trade in it.
LEARN HOW TO TRADE CRYPTOCURRENCY WITH A MASTER CRYPTO TRADER!
If you’ve booked your session above, we look forward to speaking to you soon!
Hopefully, you have enjoyed today’s article. Thanks for reading!
Have a fantastic day!
Richard Baker Live from the Platinum Crypto Trading Floor.