Does Technical Analysis Work with Cryptos?
Much like a stock, cryptocurrencies are driven by fear and greed.
And much like a stock, you need to be greedy when others are fearful, and fearful when others are greedy, as Warren Buffett would advise.
But how to we know when that happens?
One way is to use simple technical tools that pinpoint the exact moments that fear and greed are getting way out of hand. To do so, think of a crypto like a rubber band. We can only pull that rubber band so far before it snaps back and begins to revert to mean.
Look at a one-year Bitcoin Cash for example using:
Bollinger Bands (2,20),
Relative Strength (RSI),
Fast Stochastic,
Moving Average Convergence Divergence (MACD)
About 80% of the time when the upper Bollinger Band is hit or penetrated, confirmed with a move to or above the RSI 70-line, a move to or above the 80-line on Fast Stochastic followed by a spike in MACD, the coin begins to pivot and turn lower.

We saw this happen in November 2017, December 2017, and again in February 2018.
A lot of times we can call the bottom of a coin, too using the same indicators.
Notice what happens as the coin nears its lower Band with a move to 30 on RSI, confirmed with a move to less than 20 on Fast Stochastic followed by a dip in MACD. The coin begins to pivot and move higher. The most recent example of this was in February 2018.
We can see it happen with Ethereum Classic, too.
.png)
In fact, any time Fast Stochastic jumped above its 80-line over the last few months, coupled with RSI at or near 80 with it at its upper Band, the coin pulled back. We can see this happen quite a few times since December 2017.
Then, each time, the coin was at or near its lower Band with RSI at or near its 30-line, confirmed with Fast Stochastic under its 20-line, the coin again pivots and moves higher.
Make sure that when you use these indicators that you always confirm your findings, and use multiple time frame charts. Typically, I’ll use a six-month, one-year and full historical chart to make a decision as to when I’ll buy and sell a coin based on fear and greed.
This is just one way to identify potential pivot points with cryptos.
We can also begin to look at double and triple tops and bottoms, for example.
Two of the most basic technical patterns to master are support and resistance levels.
When looking at fear and greed on a chart, we begin to look at the technical parameters of support and resistance, or a price floor or ceiling, as we noted in our initial discussion on support and resistance lines.
When prices are falling to the floor, support represents the moment when buying begins to overwhelm selling and prices begin to bounce back. Conversely, when prices move to the ceiling, resistance is the point where selling begins to overwhelm buying and price increases begin to reverse.
You can identify support and resistance by studying charts.
Look for a series of low points when a stock continues to fall to a certain level, but then doesn’t fall any more. Typically, this is support. And when you find a stock that rises to a certain high, but rises no more, you have found resistance points.
The more times a stock bounce off support and resistance, the stronger these support and resistance lines become for technical analysis. If something repeats itself again and again, it becomes a stronger indicator of potential pivots at high or low points on a chart.
Two ways to find great support and resistance is through the identification of double tops and bottoms, for example. If your stocks bounces off the same support level, or fails at the same resistance level at least twice, we can make an argument for selling or buying said asset at each pivot point.
When it comes to double tops, these can typically be found at the peak of an upward trend, and can oftentimes be a signal that the prior upward move is beginning to weaken with buyers losing interest.
A double bottom on the other hand is the opposite.
It can signal the reversal of downtrend, and begin to show us strength after an asset pulls back. Once double bottom is proven to hold, an argument can be made for a potential reversal to the upside.
If you can identify such patterns you increase your odds of success.
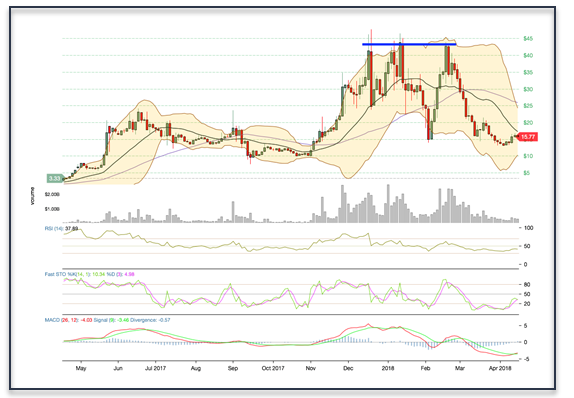
Let’s again look at Ethereum Classic.
Notice the three attempts at breaking above triple top resistance around $42. Once it failed to breach that level and break to the upside, it fell apart fast.
.png)
Or, we can look for double and triple bottom support for example. Notice the triple bottom support line here dating back to February 2018. Should April 2018 support at $15.77 hold, we can argue for triple bottom and potential upside.
.png)
In short, technical analysis does work well with cryptos simply because it’s another asset driven by bouts of fear and greed.
To the question in your title, my Magic 8-Ball says:
Hi! I'm a bot, and this answer was posted automatically. Check this post out for more information.