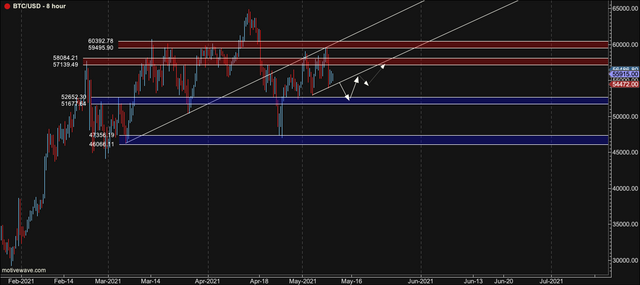
BTC/USD technical analysis May 11, 2021
Last week we hear from all sides how the crypto flies up and the sky is the only limit.
Is that really so? By the way, at a time when it was great fashion to buy Gold, there was one saying among the traders of the Big4:
"Even if your taxi driver talks about buying gold, it's time to sell!"
Here is the BTC/USD chart TF 8hours. The first important thing is that we are still well below the main rising trendline. Actually, we're at the bottom of the rising tunnel. But that doesn't mean it's time to buy for a long position. Even the last 4 candles rather suggest that another drop may come soon.
So for me, a scenario where the price drops even more into the support zone is more likely. This support zone has proved to be a relatively strong resistance zone in the past. The first reasonable entry into a long position is therefore in the range between 52.700 and 51.700 for me. (The first support zone) with SL just bellow this zone. My target will be the first zone of resistance between 57.100 and 58.000. Anyway, after touching the price with the bottom of the tunnel, we can expect a slight drop, so this will be the place where I move my SL to BE. Just to be sure. There is nothing worse (and more unnecessary) than when a profitable position becomes a loss.
If you decide to trade BTC / USD in the coming days, I wish you a lot of success, whether you stick to my analysis or go against it. Just keep in mind that the probability of a more significant drop is quite high.
Enjoy your trades and days!
