Price Function of ETH
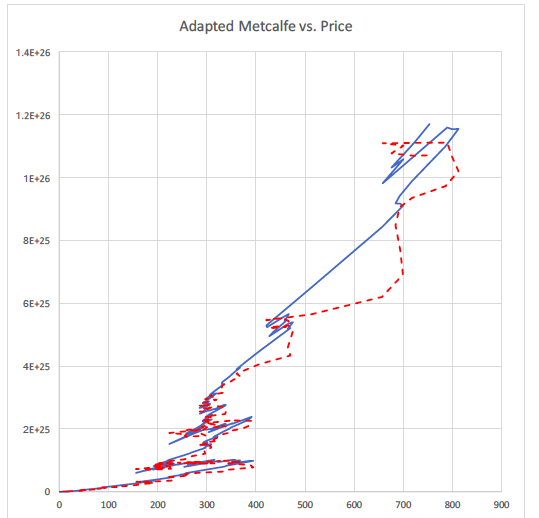
We know that adapting Metcalfe's law (Supply^2 * Users * Price) gives us a 94% price correlation as a 5-day moving average.
Now, we examine the price correlation of market and network value, and price volatility. Market value is USD market capitalization (as reported by CoinMarketCap) divided by the number of daily transactions. Network value is defined as the P/E ratio, or market capitalization (supply*USD closing price) divided by the number of daily transactions. Price volatility is reflected in the intraday percentage difference between the high and low price (High-Low Difference %).
We will see how these subtle differences in terms of market and network perceptions of value and value capture yield significant price ramifications.
Next, we use the Volume (24hr, USD) to calculate the average amount of shares per transaction, and then assign a network and market value per share accordingly. The difference between the network and the market's value per share is defined as Value:Share Difference %.
The High-Low Difference % had a 67% correlation with price, while the Value:Share Difference % was 25%. Therefore, we weighted the X-factor variable as:
2/3: High-Low Difference %
1/4: Value:Share Difference %
~8.33% (price control dummy)
Each variable is weighted and multiplied by price, then summed. The X-factor correlation with price is 92%.
This model shows
1)A positive correlation between:
A) Market value capture (<0%) and price volatility
B) Network value capture (>0%) and price volatility
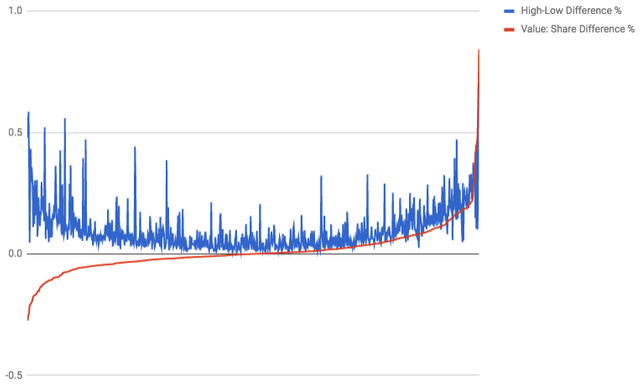
C) As price volatility increases, % of value capture (network and market) increases.
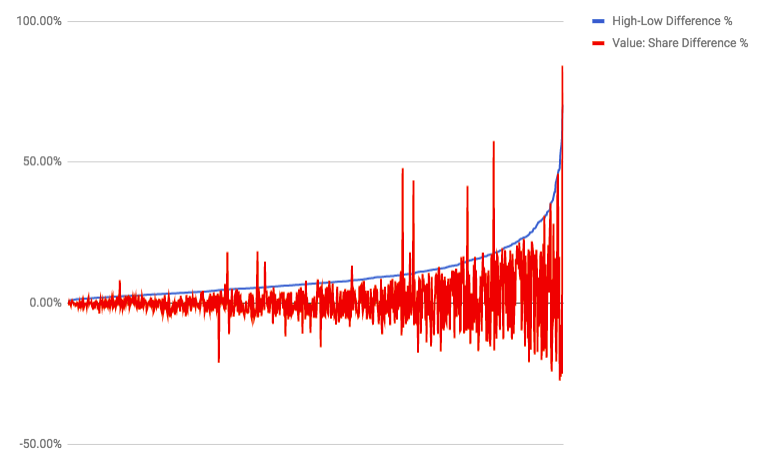
- Volatility and Value Capture affect Price
.png)
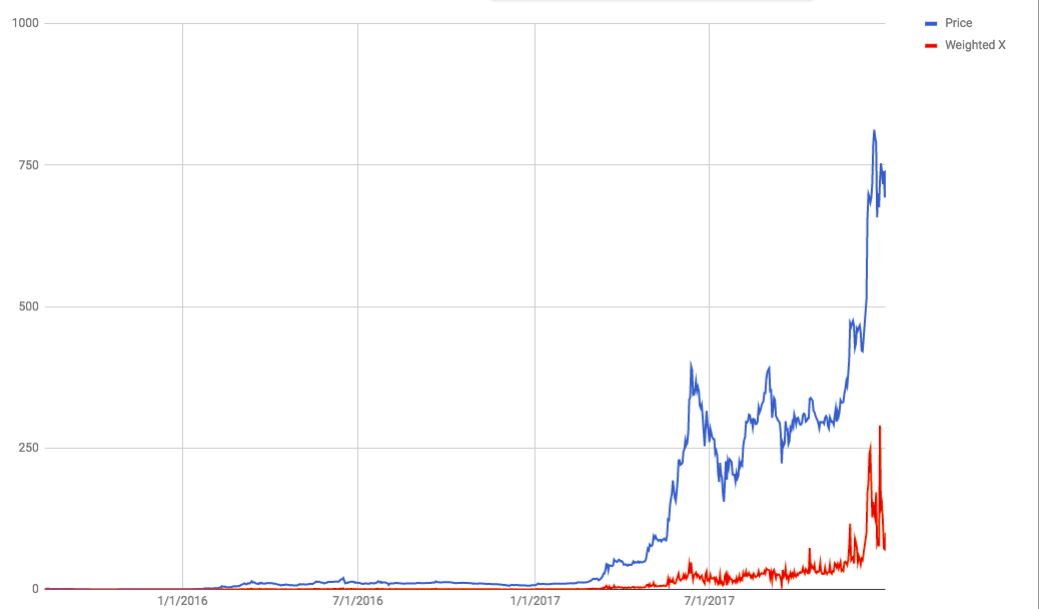
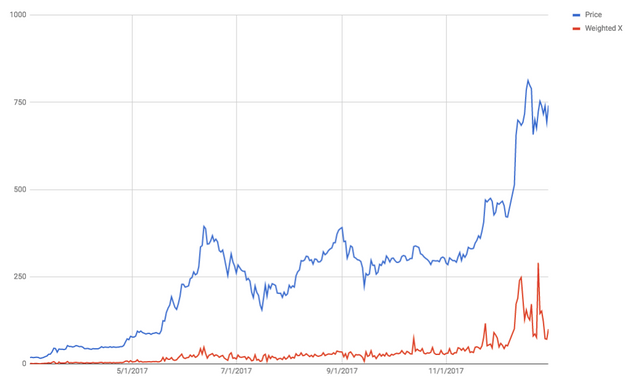
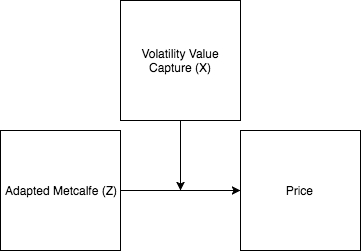
Future research should look at the relationship between Adapted Metcalfe (Z) and this X-factor (Volatility Value Capture, X), as follows:
.png)