Why I Shorted Ripple Today

Today was an excellent day for trading. Made bank on a number of trades off the back of overall (and expected) weakness in the cryptocurrency market. As mentioned in previous posts, the rallies in Bitcoin have not been convincing. For the most part, the price of Bitcoin has been consolidating and trading sideways. This price movement has been great for swing/day trading the altcoin/USD pairs!
With that said, I thought I would share with you a trade on Ripple which was posted to my TradingView account earlier today which you can follow me here => https://www.tradingview.com/u/cheesetoast/
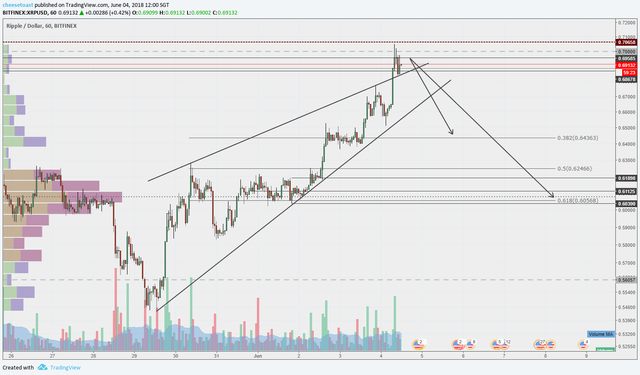
RIPPLE - Short Opportunity - 12% ROI - Risk/Reward 4:1

Now as you will see in the chart above, a lot of the major altcoins (and Bitcoin) were forming a rising wedge pattern with a series of slightly HIGHER HIGHS. This is a very bearish pattern that suggests the buyers are gradually losing strength.
Typically, this pattern is traded on a breakout of the lower trend line. However, we can often see another bearish scenario unfold that involves a breakout to the upside. Confused?
This scenario occurred on Ripple today.
Generally speaking, traditional technical analysis would classify a break above a trend line which acts as "resistance" to be a BULLISH signal and to enter into a long position on a re-test trend line turned "support".
Let me say, support and resistance lines/zones are simply not high probability areas to trade.
So why did I short on the breakout?
The area between 0.68 and 0.70 was the origin ("consolidation zone") of a previous breakout trade to the downside in which the supply exceeded demand. There was a high probability there would still be pending sell orders at this level.

As soon as the price of Ripple stalled at this area after the initial pop out of the rising wedge pattern, I knew this was a FAKEOUT aka FOMO'ers that were attempting to catch the wave of the next bullish leg. Majority of these traders will place a stop loss underneath the trend line which has now turned in "support".
Rookie error.
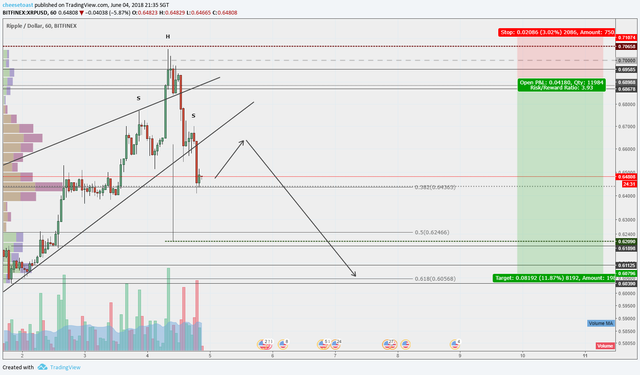
As you can see, the price of Ripple smashed back down and taking out all of the stop loss orders to complete the rising wedge pattern.
For rising wedge patterns, I like to target the 38% and 61% Fibonacci levels from the swing lows to the swing highs with stops above the HIGH. This particular trade on Ripple offered a 12% ROI with a 4:1 risk/reward ratio and was able to move my stop loss to break-even almost immediately.
There is now a head and shoulders pattern that has formed. The projected target of this pattern, should it complete is near the 50% Fibonacci retracement level. I will remove majority of my position at this point and leave the remainder on in case the price of Ripple falls further to the 61% level.
For those that missed the action earlier today, it is likely that Ripple will move back to the neckline that would offer a favourable area to enter into a continuation trade setup.

How did you short ripple...what were the step on the exchange to short ripple?
Margin trading on Bitfinex . You can transfer USD to margin account and short sell like a normal platform
Thanks.
hey toast,
what do you mean exactly by 'There was a high probability there would still be pending sell orders at this level'?
Do you mean above the trend line and therefore scooped up by the fomo'ers on the way up?
Love all your TA and posts btw.
cheers
Thanks for the feedback! Appreciate it! @herbnspice
Have a look at the 4hr chart below and look to the left. You can see a previous breakout pattern with a tight squeeze ("consolidation zone") between 0.68 and 0.70 (grey area).
The strength of move/breakout to the downside was very strong. Roughly 6 times the range of the consolidation zone with no retracement!!! This tells us there was a significant imbalance between buyers and sellers. That is, there was more sell orders filled and few unfilled buy orders.
Given the speed and strength of the move, it is likely not all sellers orders would have been filled at this value area and would have missed the boat (I think its safe to assume whales do not market buy/sell into a position).
As price gradually returns to the consolidation zone, the number of unfilled buy orders will start to decrease as we know already know there was an imbalance in this value area. Therefore, we can assume it is a higher probability trade to sell into this area.
Hope that helps. I'm more of a breakout/pattern trader but aware of the general concept. Check out @rollandthomas. He specifically trades supply and demand zones and can probably explain better than me.
Thanks for the detailed response mate, much appreciated - i see what you mean.
It's worth noting also the speed and strength of the move was highly attributed predominantly due to btc's dominance and effect on the overall crypto market, where charts across all/most alts seems to be a blueprint over this specific period.
I'll check out rollandthomas, thanks for the link/tip.
cheers