Basic Attention Token: Intraday Timeframe Chart Patterns
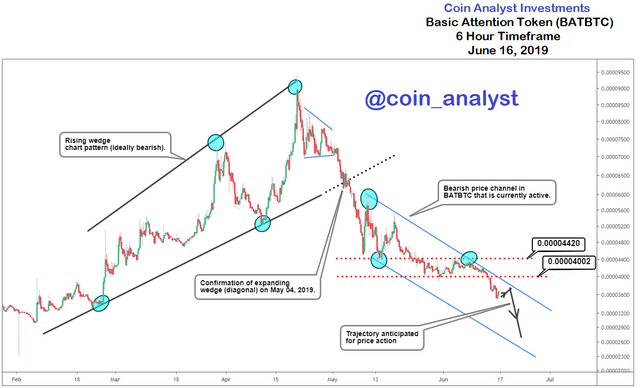
Conclusion for today’s Basic attention token analysis: The current downtrend in BATBTC is expected to target the bottom of the bearish channel at ~0.00002412.
Price action for Basic Attention Token (BATBTC) is presented today on a log scale using a 6 hour timeframe candlestick chart. Coverage of market action is from the downward spike on February 01, 2019 to current date.
During the duration mentioned above, the overall trend (or price swing in this case) did move from up to down.
The uptrend is highlighted using a rising wedge (diagonal) that was confirmed on the May 04, 2019 when price closed below the bottom boundary of the pattern.
Follow us on Social Media!
Instagram: https://www.instagram.com/coin_analyst/
Twitter: https://twitter.com/Cryptotrader029

Also shown on the chart is the current bear channel that is active and helps provide context for the ongoing downtrend. Key price level to watch in BATBTC is between 0.00004420 and 0.00004002 as any retracement in the downtrend could possibly target the region prior to continuation of the downtrend.
The trajectory that is expected for price action is therefore indicated with the bottom of the channel at ~0.00002412 provided as a target to take profit on any short (sell) order(s).
Our previous Bitcoin analysis (BTCUSD) before the current price rally was also posted for FREE and can be found below.
https://coinanalyst.investments/2019/04/26/btc-analysis