SALT/BTC Chart Analysis, Upcoming Buy Opportunity
Hey Steemians,
I did this chart analysis because another steemian's (@haejin) analysis got me interested in it.
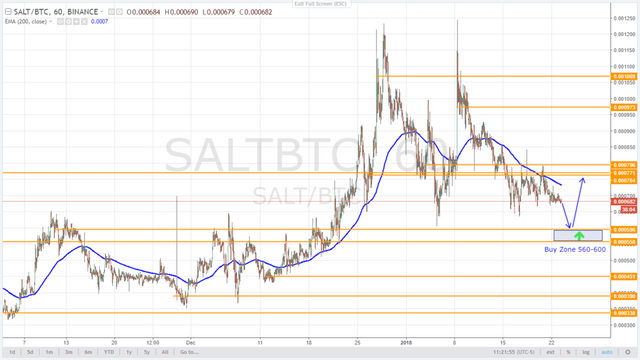
It looks to me like 560-600 is a great buy zone for a bounce back up to 700 to 760 area.
Here is the zoomed out hourly chart on SALT/BTC:
and here is a more zoomed in hourly chart:
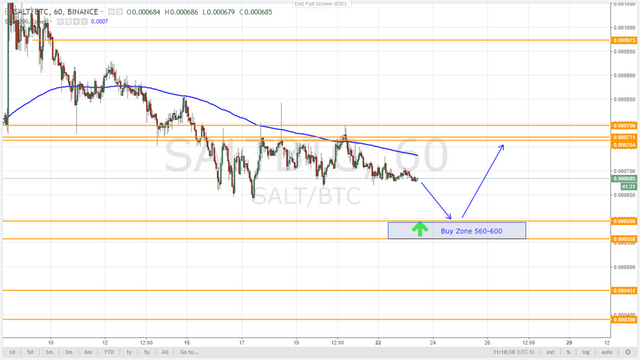
Whenever there is a big gap between the old supply and demand zones, it makes for a good buy or short opportunity.
If you want a better explanation of these levels you can checkout my first post, the link is below
https://steemit.com/cryptocurrency/@cryptotradesalot/alt-coin-buy-trade-opportunity-req-btc
Also if you would like me to post a chart of a specific Altcoin or currency then please post the name in the comments below and I will make a post of the chart of that currency/coin with my analysis. Also if you would like a more time sensitive analysis, let me know and I will make one using a smaller time frame such as 5 minute chart, because the levels are at different prices based on the time frame of the chart that the supply and demand levels are created on. Also the shorter the time frame the faster the trade opportunity will play out.
Please let me know your thoughts (agree/disagree, liked the post/chart etc.)
All the best,
Crypto Rob
DISCLAIMER:
This content is my opinion and is for informational purposes only.
Always do your own research and analysis.
It should not be considered financial or investment advice.
It is not advice or recommendation to buy or sell anything .
(and all that means is that I'm just some crazy dude on the internet that you shouldn't listen to :) lol )