Multibagger Crypto Currency based on Technical Analysis
Crypto Currency Market Long term Investment
Find Multibagger Crypto Currency based on Technical Analysis
Key to create wealth
How to do own analysis? – This POST provide one simple method which helps you to find out
Multibagger Crypto Currency , or Crypto Currency which will give you multiple returns in long term
In this post I am giving my method which help you to find out Crypto Currency which will give you big return in long term, no wave analysis , no Gann analysis ,so no complications in this method .
Only daily/weekly/monthly chart with 4 price indicators will help you to find out best Crypto Currency to buy.
I have given name for this method
“ Sleeping Baby” when any child sleep look very silent ,calm, cool and when baby wake up ,then
you know how active baby is !!
Same way I look such Crypto Currencys which are currently sleeping on daily, weekly and monthly charts, but on
every green /bullish candle volume is big as compare to red candle, this indicate that smart investors
are buying this Crypto Currency or in technical term they are accumulating this Crypto Currency .
Buy when this Crypto Currency wakes up!
Now open your charting software and check below all Crypto Currency while reading this post it will help
you to understand.
All given chart are daily/weekly/monthly charts
I use TradingView chart for analysis
Here is the link: https://www.tradingview.com/chart
Open it up, search the name of Crypto Currency and look at the date mentioned in the picture & the post and how I booked profit in them.
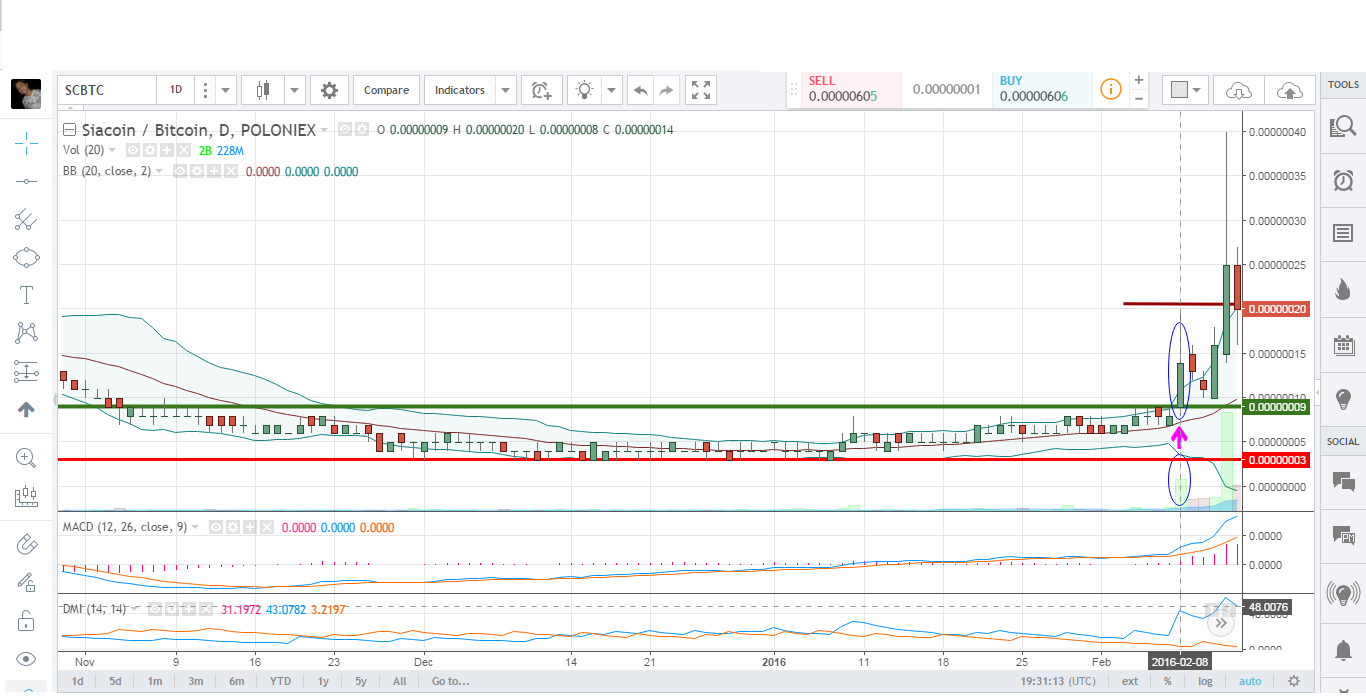
Crypto Currency name: SCBTC date: 08-jun-2016

We’ll do 4 steps analysis and trade process.
Step 1:
First you have to draw a green horizontal resistance line as showed in picture. Price must have to cross above that line and must have to close above it. Then we move to next part.
Step 2:
First indicator I use is Bolinger Band(20,2)
When price candle closes above upper band, it’s a BUY SIGNAL.
Second indicator I use is MACD(12,26,9)
When blue line is above red line, it’s a buy signal.
Third indicator I use is DMI(14,14)
When blue line is above red line, it’s a buy signal.
Fourth and last indicator I use is Volume.
When volume on that candle is exceptional high compared to last 100 trading sessions, it’s a buy signal.
Every indicator should give buy signal then only we move to our last part which is trade execution part.
Step 3:
When everything gives us buy signal, so when to buy?
We’ll buy when future candle’s price will trade above the high of our signal candle. Look at the brown horizontal line I have drawn. You have to place your buy order few points above the high of our signal candle. (Generally I place above 1% of the price or in this case 1 pip)
Step4:
Now everything is done. So when to book profit???
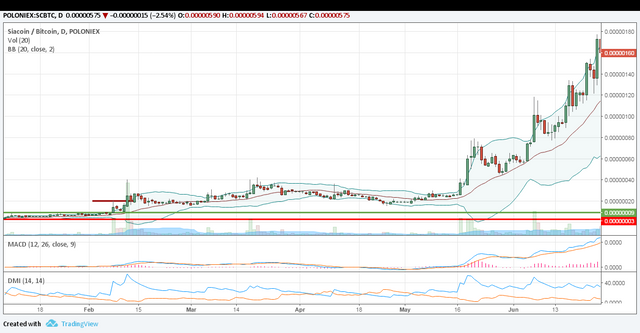
I usually book 50% of my position when price reaches 5 to 10 times of the buying price. And rest of the position I hold for more profit and sell them when market takes u turn.
See what happened next...

I brought sc/btc at the rate of 0.00000022 Today SC is trading above 0.00000600 and made the high of 0.00000850. Investment multiplied by more than 70 times. Hope this method will help you multiplying your money as well.
In my next post we’ll discuss:
- When we have to sell our remaining position
- How to know when market uptrend is over
- When to re-buy the crypto-currency we have sold
- Where to put stop loss and how to trail our stop loss & maximize our profit.
- Portfolio and money management.
Good thoughts
Congratulations @dibya! You have received a personal award!
Click on the badge to view your Board of Honor.
Do not miss the last post from @steemitboard!
Participate in the SteemitBoard World Cup Contest!
Collect World Cup badges and win free SBD
Support the Gold Sponsors of the contest: @good-karma and @lukestokes
Congratulations @dibya! You received a personal award!
You can view your badges on your Steem Board and compare to others on the Steem Ranking
Vote for @Steemitboard as a witness to get one more award and increased upvotes!