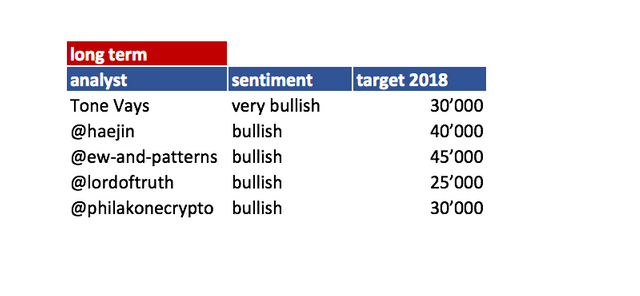
Bitcoin TA - summary of analysts - 20. Feb 18
Regular daily update on BTC ta analysts opinions.

Own comment:
- In general bullish momentum continues. In general a correction is expected to come soon - probably within next 2-3 days.
- Significant resistance seems to be between 12'100-12'500. Critical support around the 10'000ish.
Analysts key statements:
- Tone: On the weekly if we go over 11'700 numbers count turns official bullish. Daily chart runs into resistance. We started below three level of resistance and are now trading above them. If we close over them (around 11'400) he is bullish for another 2 days. Than we get a 9 which makes him expecting a pullback. 4 hour chart stagnated somehow. He expects it anyway to go two more candles up until we get a 9 and than correct.
- @haejin: It might be a triple decker inverted Head & Shoulder (iSHS) in play. next critical resistance is 12'150. Wave more and more comes aways from being three'ish (bullish sign).
- @ew-and-patterns: He expects correction wave 4 to be not completed but the wave b (on a lower degree of an ABC correction) seems to be completed. He expects wave c to go down to 10'000 support before wave 4 (on higher degree) is completed and bullish wave 5 starts.
- @lordoftruth: Affected by the iSHS the price got pushed above 11'150 as expected. Next big resistances are 12'650 and 12'850. RSI indicates that bears are coming back soon. Move upwards is therefore to be expected to keep below 12'000. Expected trading for today 10'150 - 12'600.
- @philakonecrypto: Resistance due to double channel barrier at 11'750. Count is very difficult at the moment. So no clear picture here. Support zones are 10'900ish and than 10'300.
Overall sentiment: bullish
(last: bullish)


Reference table
| analyst | latest content date | link to content for details |
|---|---|---|
| Tone Vays | 20. Feb | here |
| @haejin | 20. Feb | here |
| @ew-and-patterns | 20. Feb | here |
| @lordoftruth | 20. Feb | here |
| @philakonecrypto | 20. Feb | here |
Definition
- light blue highlighted = all content that changed since last update.
- sentiment = how in general the analysts see the current situation (bearish = lower prices more likely / bullish = higher prices more likely)
- target 1 = the next price target an analysts mentions
- bottom = price target analyst mentions as bottom
Both target are probably short term (so next few days/weeks) - lower/upper barrier = Most significant barriers mentioned by the analysts. If those are breached a significant move to the upside or downside is expected. It does not mean necessary that the sentiment will change due to that (e.g. if upper resistance is breached it does not mean that we automatically turn bullish).
If you like me to add other analysts or add information please let me know in the comments.
Thank you for your work sir. Everyone please make sure to upvote + resteem his amazing analysis always.
And thank you for all the great work you do philakonecrypto!
Done! But only because you asked <3 <3 <3
Also, done! :)
Please upvote my post in abayomi1
Wow glad to know everyone is bullish!
Freemarket is always the winner. The problem is that "government" or "global elite" control/regulate and inhibit truth art and progression.
However I always really like your pictures. I love the austin culture and appreciate you sharing.
Best Regards~*~
Why sentiment is bullish but the target 1 is lower than current market price?
That is what I probably need to explain more. Bullish sentiment is at the moment week/month focus. So it might be that an analyst expects a pullback but followed by bullish move going higher than before levels. That is when I still put him on bullish.
Does it explains that?
Nice, yeah, differentiating between short/medium/long-term sentiment is helpful.
This post very nice..i like bitcoin,,i appreciate your blog..
Thanks for your valuable and informative post.
We can gather a lot of information by your post.
By dint of we can increase our skill that is beneficial for all steemians.
I will always visit your site & wait for your upcoming post.
Thanks .........
This is very nice post. i like bitcoin. All the great work job. Thank's for the sharing post.
On February 14, I noted a buy trigger occurring near the 8870 level with an upside price target of 12,235 vs. the 5920 low. We recently got as high as 11,780, (over 2900 pts or 32% above the general entry point), and within 12% or 455-pts of capturing the upside target.
Granted, there is no guarantee that such targets will be reached, however, the trigger-point and price movement thereafter has certainly been moving in a rather positive way towards achieving that end.
Those taking such bets with nice open profits could at this point; trail stops (perhaps near the 10,700 level) to lock in such profits to assure that such a trade will not turn into a loss.
I’ll be posting another weekend update Saturday or Sunday. It should be interesting to see how the current Bull Run pans out by the weekend.
Thank you @famunger for the great service you are providing to the trading and investment community!
Thank you for sharing this valuable information and eventhough I haven’t had the chance to add you to the overview summary (what i plan to) I can highly recommend all to read your weekly update!
Please upvote my post in abayomi1
thanks for work sir.. Everyone please make sure to upvote + resteem his amazing analysis always. @famunger