Bitcoin Price Dips to Six-Month Low of $7,000
View
- Bitcoin's price fell briefly to $ 7,000, the lowest level since May.
- The following losses may extend to the falling support of the channel at the level of $ 6800, while the weekly chart indicator shows the strongest bearish bias since March.
- Intraday charts report oversold conditions. As a result, consolidation or a slight rebound of up to $ 7,500 can be seen before a deeper decline.
- A break above $ 8,231 is needed to nullify lower highs and confirm a short-term bullish reversal. The weekly forecast will become bullish when the RSI rises above 53.00.
Bitcoin price fell to a six-month low on Friday, and a technical indicator with wide tracking showed the strongest bearish bias in eight months.
The number one cryptocurrency at market value fell to $ 7,009 on Bitstamp at 10:05 UTC - the lowest level since May 17 - erasing the entire rally from $ 7,293 to $ 10,350 in October, plus some.
At the time of publication, BTC recovered slightly and is trading at $ 7,220, down 8 percent in 24 hours.
The downtrend looks steady, as the weekly relative strength index (RSI) - an indicator used to confirm market trends and overbought and oversold conditions - fell to 43.00, the lowest since mid-March. A reading below 50 indicates bearish conditions. Thus, it is safe to say that market sentiment is extremely bearish.
Weekly chart
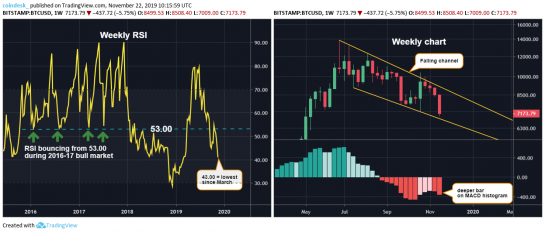
The RSI is well below 50 and points south (above the left), confirming a bearish trend in the market. The MACD histogram also prints deeper bars below the zero line, indicating a stronger bearish momentum.
Cryptocurrency is locked in the falling channel (top right), represented by trend lines connecting the highs of June and August and the lows of July and September.
As a result, a further drop in channel support by $ 6,800 cannot be ruled out. Nevertheless, according to intraday charts, at first you can see a slight rebound to $ 7,700–7,700.
Hourly and 4-hour chart
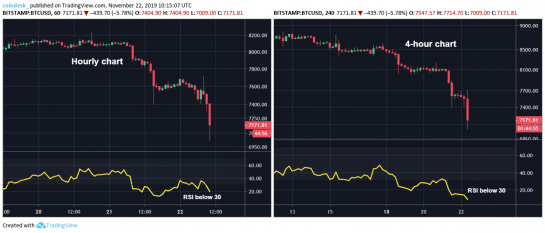
RSI on the hourly chart produces higher lows, unlike lower lows on the price chart - bullish divergence, suggesting that sellers may run out of steam. RSI on the 4-hour chart fluctuates significantly below 30, indicating oversold.
8-hour chart
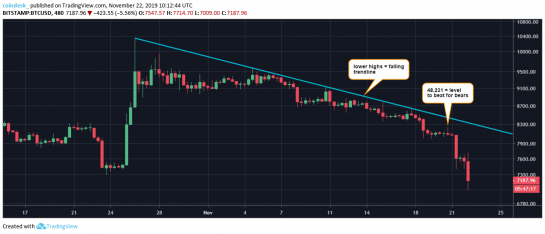
A series of lower highs and lower lows seen above indicate that the bears are in control. The near-term prospects will become bullish only if and when prices invalidate the establishment of lower highs with a movement above $ 8.231.
In general, the weekly forecast will remain bearish as long as the RSI holds below 53.00 and the price is trapped in the falling channel.
Please note that according to the rules of the textbook RSI above 50 implies a bullish reversal. In this case, however, 53.00 is a demarcation line between bulls and bears.
This is due to the fact that the indicator has consistently rebounded from the level of 53.00 in the bull market in 2016-17. This level was violated in early January 2018, after which BTC fell to $ 6,000 on February 6.
This post received a 38% vote from @randowhale thanks to @icon88! All funds sent to @randowhale will be used to improve the SBD peg and will be burned at a later date.
Congratulations @icon88! You have completed the following achievement on the Steem blockchain and have been rewarded with new badge(s) :
You can view your badges on your Steem Board and compare to others on the Steem Ranking
If you no longer want to receive notifications, reply to this comment with the word
STOPTo support your work, I also upvoted your post!
Vote for @Steemitboard as a witness to get one more award and increased upvotes!