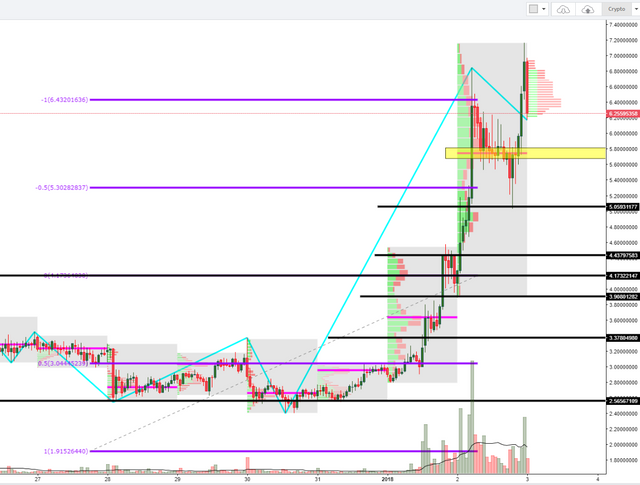
STEEM to keep bullish price action, $5.8-$6.0 key volume zone
Steemit Price Analysis
Massive volumes hitting the Bittrex exchange led the price of Steem to rise into fresh all time highs, allowing the next generation blockchain-based social platform to make global headlines as 2018 gets underway.
The spike in STEEM vs USD has come in a cycle of 3 waves, well observed from the 30-minute price chart, finding a temporary top just ahead of $7.00, with $5.3 and $6.4 being the actual 50 & 100% target projections based on the trading box of roughly $2-$4 during Dec, with the edges well observed from the latest swing high-low on Dec 21-23.
The most extreme price target at $6.4 suggests that any overshoot of prices exceeding the level will most likely be encountered with a stampede of offers that is set to absorb further rises for a potential retreat.
This scenario will be negated should we find acceptance (prolonged consolidation above $6.4), in which case, price discovery dynamics may further defy gravity by pushing the price into a higher target towards $7.5, where profit-taking is expected.
On the flip side, failure to consolidate above $6.4 suggests a potential retracement down towards the $6-$5.8 zone, where Jan 2 POC lies (POC refers to point of control, where most volume traded). That's where buyers are expected to step in to re-engage in the bull trend. Note, a break below this level would expose lower price into $5-$5.20 vicinity, where, as seen by the dead cat bounce on Jan 2, plenty of bids are expected to rest.

Disclaimer: The information contained herein is not guaranteed, does not purport to be comprehensive and is strictly for information purposes only. It should not be regarded as investment/trading advice. All the information is believed to come from reliable sources. The creator of the content does not warrant the accuracy, correctness, or completeness of information in its analysis and therefore will not be liable for any loss incurred.
Footnotes:
Given the discrepancies in price levels on different exchanges, which may lead to arbitrage opportunities, in order to keep our technical studies consistent, the chart selected for analysis will always be the dominant by trading volume. Readers should extrapolate mentioned levels to own respective charts. You can see the name of the exchange on the top left corner of every chart.
The zigzag indicator is utilized to represent the latest cycles in the market. Markets tend to move in cycles of 3 followed by a period of distribution and/or accumulation. Market Cycles are repetitive patterns that provide both market magnitude and timing studies in a very dynamic analytical approach.
The volume profile analysis tracks trading activity over a specified time period at specified price levels. The study reveals dominant and/or significant price levels based on volume. This process allows to understand market opacity. The yellow rectangles in the chart represent the areas of most interest by trading volume, and should act as walls of bids/offers that may result in price reversals.
Technical analysis is subject to fundamental-led news (one should see both components as inter-dependent). Any unexpected news on a specific project may cause the price to behave erratically in the short term, while still respecting the most distant price references given.