But even if you have used this strategy on daily charts the result in your picture would have been 6 wins and 7 losses. Not sure how you got 9 losses and 3 wins ?
The strategy is very simple…Every-time when you see 3 candles of the same color in a row, you would place a bet on opposite color. So if you see 3 red candles in a row, you would bet that candle #4 will be green. That’s it.
But even if you have used this strategy on daily charts the result in your picture would have been 6 wins and 7 losses. Not sure how you got 9 losses and 3 wins ?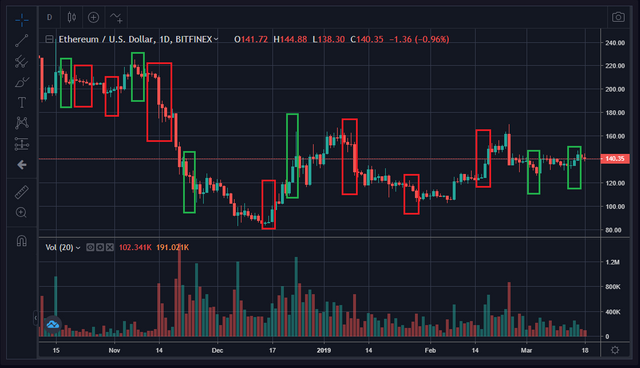
The strategy is very simple…Every-time when you see 3 candles of the same color in a row, you would place a bet on opposite color. So if you see 3 red candles in a row, you would bet that candle #4 will be green. That’s it.
Seen it now, quite a strategy. Thanks for the explanation