Bitcoin is heading back up again, or is it?
So this is just a quick analysis on the recent surge in the price of bitcoin, I felt it need to be said after just reading through this report on how someone believes bitcoin has shot through major resistence lines...
HERE IS THE TRUTH!
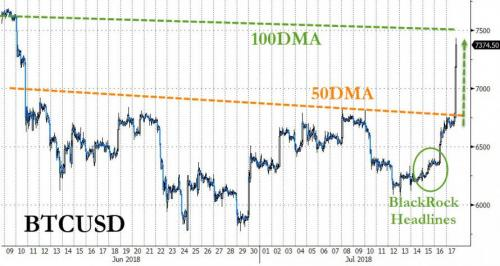
The article in question suggests the above chart shows bitcoin EXPLODING through KEY technical resistance.
The problem as I see it is this is a VERY short sighted view, you can stop reading now, but if you would prefer to keep more of your money and possibly learn something about technical analysis then please read on.
True Bitcoin Chart Analysis
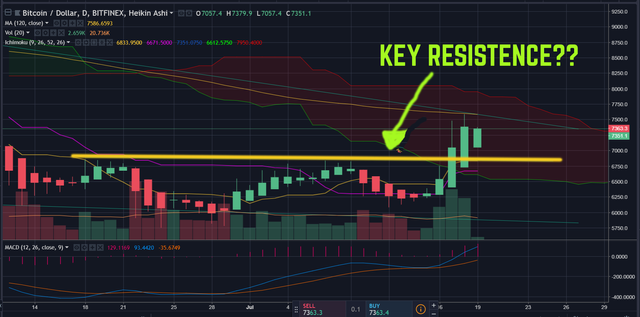
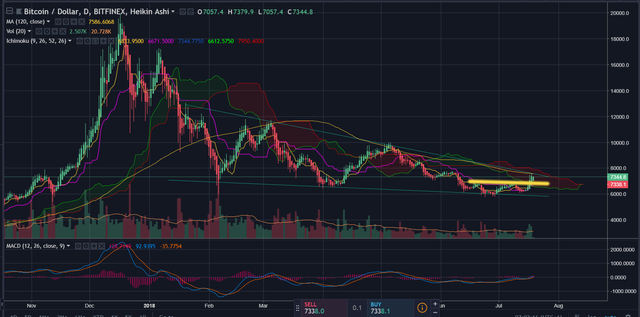
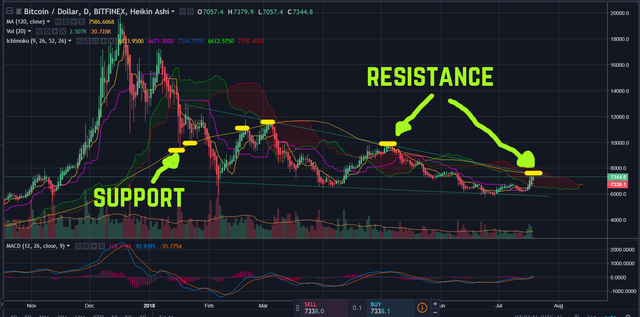
Above you can see the KEY resistance level indicated, below is a zoomed out chart of the year so you can see where we truly are. I'm sure you will agree that NO key resistance has been broken.
Only continue reading if you want to know what is the most likely move for the price of bitcoin over the next couple of months.
Whole Number Resistance
Whole numbers can be a form of resistance as it is human nature to set buy and sell orders in these zones. So whole numbers would be numbers such as 100, 50, 12,000 or in this case 7,500!
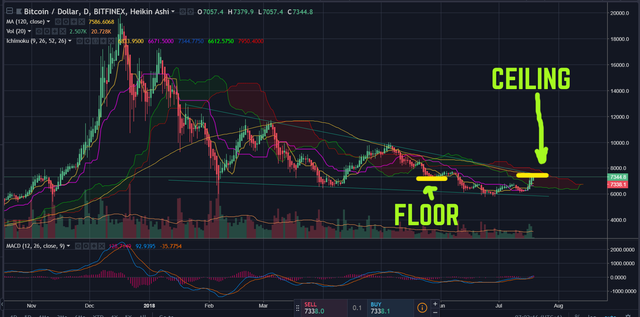
Floor & Ceiling Resistance
In trading it is extremely common for the previous low point to become the new high in a bear market and previous high to become the new low in a bull market, my question to you is:
"Is bitcoin in a bull or bear market right now?"
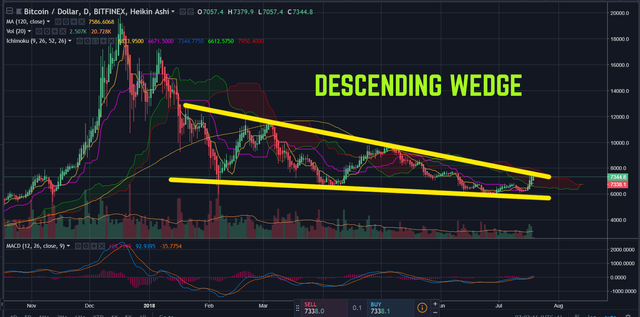
Descending wedge - Trend Lines
Whether bull or bear you can usual run a straight line along the tops or bottoms of the candles that will show a clear trend line.
What you see below is the trend lines squeezing the price, fuelling a breakout. As the peaks are getting lower as time has gone on we know bulls are getting more pessimistic and the price will likely be getting squeezed until it eventually breaks out through the bottom trend line!
Moving Average
The golden yellow line in the chart below shows the 120 day moving average. This for bitcoin has always been a very important line of resistance.
Just take a look at it through the past few years on a chart for yourself, you'll be glad you did ;-)
But this year we are stuck below the 120 day moving average so we would need some huge upward momentum in order to break through.
You can see in the chart below that every time the price of bitcoin has hit this line it reverses!
Ichimoku Cloud
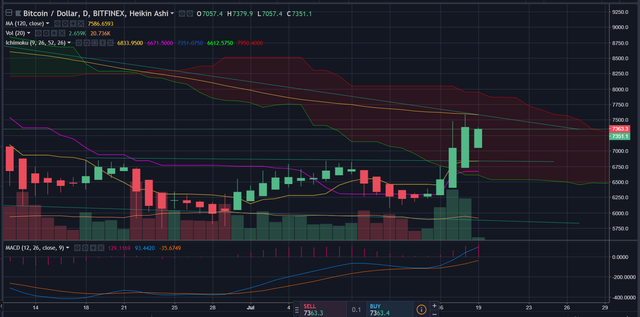
Behind the candles you can see a red and green "cloud", this is a japanese technical analysis tool called the ichimoku cloud. I don't wish to go into too much depth on this right now but all you need to know is that the outer edges can form resistance.
Notice how bitcoin had to surge through to break into the cloud, breaking out is just as hard!
Conclusion
To get out of the Ichimoku cloud bitcoin would need to have enough buy pressure to push it past all other resistance areas built up around the $7,500 mark.
This does not look as though it is going to end well for bitcoin in the short term.
I would suggest that it would be highly likely that bitcoin will fall and break through the lower resistance level and drop down to find lower support possibly around $4,500 or even $3,000.
HOWEVER... Once it becomes so "cheap" it should encourage more buying and the price switch over back into a bull market by the end of the year.
Things to note: Since bitcoin has the power to move the entire alt-coin market, get ready for further drops across the board :-(
I have more information on this in yesterdays video as well as a new coin that should give you a x9 minimum despite any drop in bitcoin.
WELL WORTH CHECKING OUT:
nice work
Congratulations @moocharoo! You have completed the following achievement on Steemit and have been rewarded with new badge(s) :
Click on the badge to view your Board of Honor.
If you no longer want to receive notifications, reply to this comment with the word
STOPTo support your work, I also upvoted your post!
Do not miss the last post from @steemitboard:
SteemitBoard World Cup Contest - The results, the winners and the prizes
Excellent analysis, thanks for the post! Hopefully this is the beginning of an upward movement, i'll be watching closely.
Upwards would be nice, but I wouldn't be too concerned if it did take a drop lower, got my eye on buying up a bunch of alt-coins nice and cheap if the opportunity presents itself ;-p
Congratulations @moocharoo! You have completed the following achievement on Steemit and have been rewarded with new badge(s) :
Click on the badge to view your Board of Honor.
If you no longer want to receive notifications, reply to this comment with the word
STOPDo not miss the last post from @steemitboard:
SteemitBoard World Cup Contest - The results, the winners and the prizes
Congratulations @moocharoo! You received a personal award!
Click here to view your Board