RIPPLE PRICE ANALYSIS Ripple Price Analysis: XRP/USD Made Double Top?
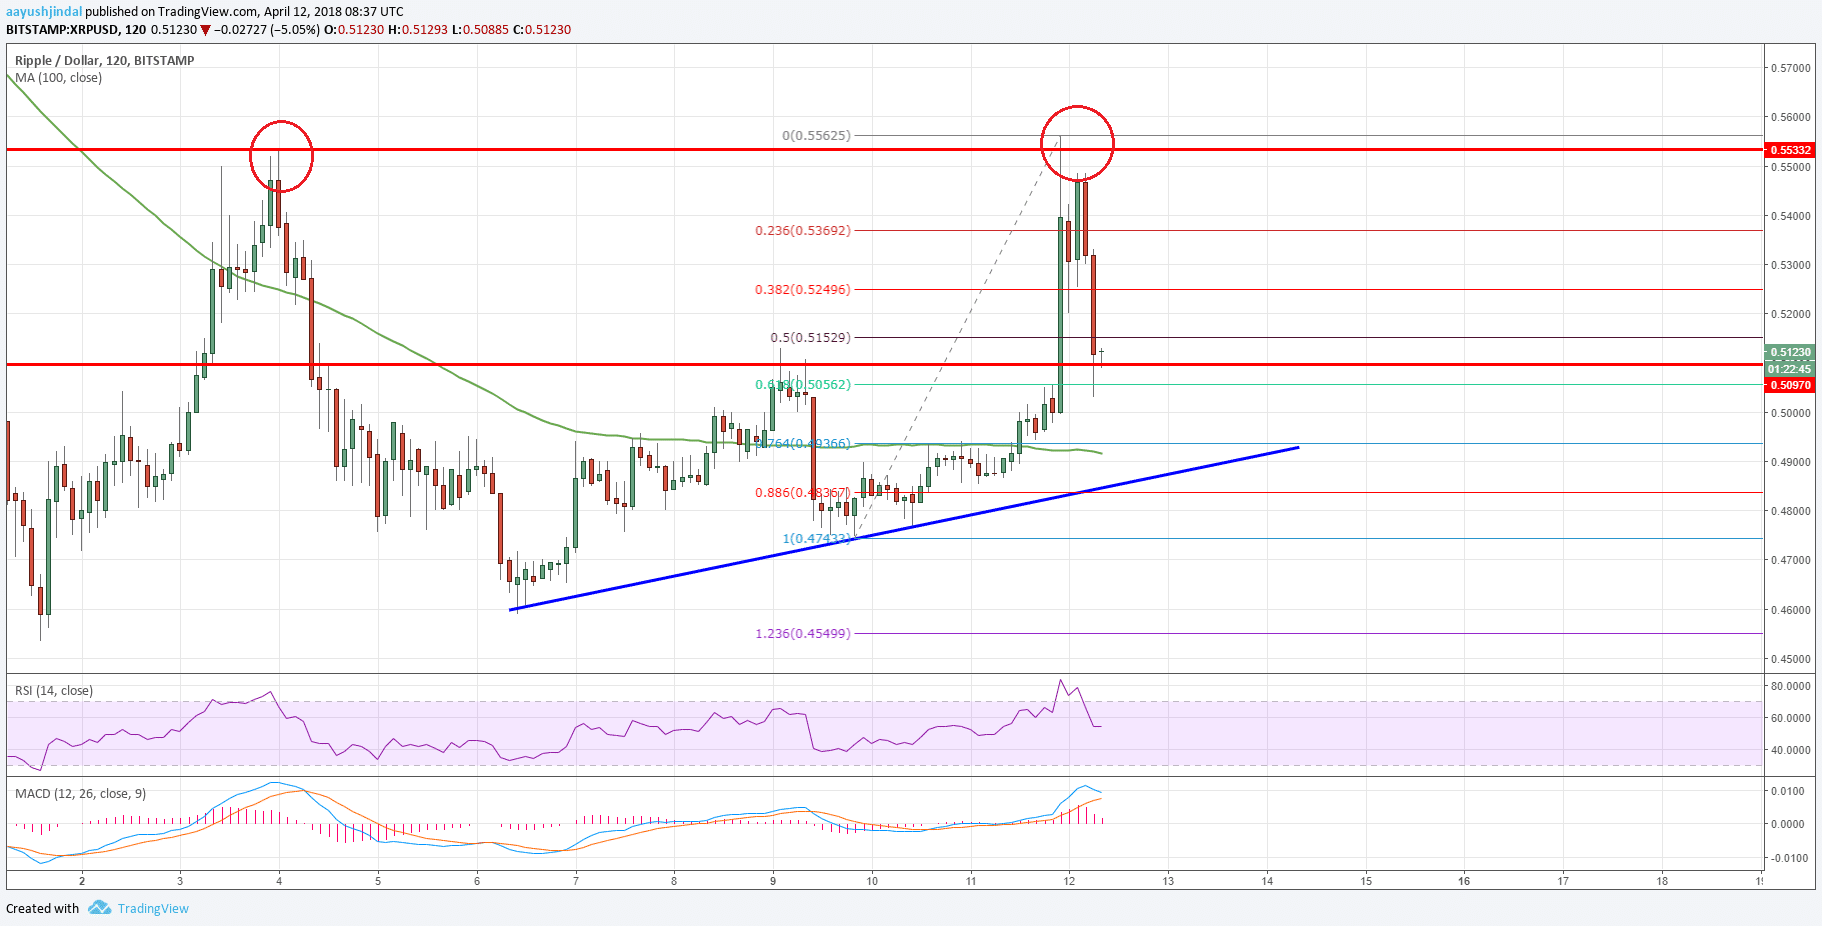
Ripple price traded higher but failed near the $0.5530 level against the US Dollar. XRP/USD likely made a double top pattern and it could decline short term.
Key Talking Points
Ripple price traded higher recently, but it could not break the $0.5530 resistance against the US Dollar.
There is a major bullish trend line forming with support at $0.4900 on the 2-hours chart of the XRP/USD pair (Data feed via Bitstamp).
The pair may perhaps find support on the downside near the $0.4950 and $0.4900 levels.
Ripple Price Forecast
During the past few sessions, there was a rise above the $0.4800 level in Ripple price against the US Dollar. The XRP/USD pair surged higher and traded above the $0.4950, $0.5250 and $0.5300 resistance levels.
However, the upside move was capped by the $0.5530 level. The stated level $0.5530 prevented gains earlier as well, which means the price was rejected twice recently from the $0.5530 level.

It seems like a double top pattern is forming near $0.5530 and the price may decline in the short term. It has already broke the 50% Fib retracement level of the last leg from the $0.4743 low to $0.5562 high.
At the moment, a pivot zone near $0.5080 is acting as a support. Moreover, the 61.8% Fib retracement level of the last leg from the $0.4743 low to $0.5562 high is also acting as a support at $0.5056.
Should there be a downside break below $0.5056, the price may test the 100 simple moving average (2-hours) at $0.4950. There is also a major bullish trend line forming with support at $0.4900 on the 2-hours chart of the XRP/USD pair.
As long as the price is above the 100 simple moving average (2-hours) at $0.4950, there is a chance that XRP might bounce back. However, a downside break below $0.4950 may ignite further losses towards the $0.4500 level in the near term.
On the upside, the $0.5500, $0.5530 and $0.5560 levels are major hurdles for an upside continuation in ripple price.
Trade safe traders and do not overtrade!