AI powered trading (part II)

In this blog post you will find out
- Whether technical indicators are useful for predicting cryptocurrency prices
- How much you can improve your predictions using alternative data, such as blockchain structure and reddit activity
- How you can (and should) use machine learning to aid you in trading
Supervised learning
While using reinforcement learning in real-world trading applications is definitely promising and will undoubtedly be used in the future, it still suffers from a number of issues preventing it from going mainstream:
- Very computationally intensive. Production-ready reinforcement learning models take days to train even on high-end GPUs.
- Need a lot of data. At its core, deep Q learning algorithm is trying to learn the reward function given the state of the system (i.e. what will happen to my portfolio if I buy some currencies and short some others). Thus, you need to feed the model detailed information about every aspect that can influence the markets.
- Need a thorough and accurate simulation environment. Reinforcement learning agents learn by trial and error by performing actions in a simulated environment. If you train a capable agent on historical data and give it, say, $100 to play with, the AI can learn to trade it profitably. However, such agent will not learn how its actions affect an asset's price without a proper market simulation environment. And thus an AI that can generate profits on $100 investment can be completely useless if you let it trade with $1,000,000.
Supervised learning is less susceptible to these drawbacks. The goal of a supervised learning model is to learn the relationship between features, such as daily trade volume, current price, number of twitter followers, and predict the target variable, such as tomorrow's price, using those features. In this post, we'll apply elastic net model to a number of ethereum related datasets and discover which features are more important when it comes to cryptocurrency price prediction.
Datasets
I've collected three datasets related to ethereum for this analysis: market data from coinmarketcap, blockchain data from etherscan and community data from reddit for the first six months of 2017. We will use january-june data for training our models, and june data will be reserved for validation.
Market data:
| date | close price | volume | market cap |
|---|---|---|---|
| 2017-06-30 | 294.92 | 1011800000 | 28161900000 |
| 2017-06-29 | 302.88 | 1508580000 | 30495300000 |
| 2017-06-28 | 327.93 | 2056550000 | 27207000000 |
| 2017-06-27 | 293.09 | 1973870000 | 25309700000 |
| 2017-06-26 | 272.69 | 2081810000 | 28111200000 |
| 2017-06-25 | 303.25 | 1186880000 | 30005900000 |
Blockchain data:
| date | difficulty | estimated hashrate | block time | block size | transactions | block count | uncles count | new addresses |
|---|---|---|---|---|---|---|---|---|
| 2017-01-01 | 79.895 TH | 5746.3882 GH | 14.09 | 1390 | 38730 | 6111 | 337 | 1606 |
| 2017-01-02 | 80.591 TH | 5772.7032 GH | 14.21 | 1458 | 39652 | 6058 | 353 | 2248 |
| 2017-01-03 | 80.545 TH | 5701.1528 GH | 14.28 | 1627 | 45883 | 6035 | 385 | 2661 |
| 2017-01-04 | 87.318 TH | 6330.7660 GH | 13.99 | 1717 | 50673 | 6141 | 393 | 3527 |
| 2017-01-05 | 90.096 TH | 6451.8286 GH | 14.10 | 1676 | 49596 | 6091 | 381 | 3319 |
| 2017-01-06 | 91.837 TH | 6519.8016 GH | 14.32 | 1593 | 43804 | 6009 | 373 | 3312 |
Reddit data:
| authors | comments | score | date |
|---|---|---|---|
| 144 | 672 | 3136 | 2017-01-01 |
| 179 | 946 | 2748 | 2017-01-02 |
| 228 | 998 | 3462 | 2017-01-03 |
| 219 | 1080 | 3276 | 2017-01-04 |
| 236 | 976 | 4294 | 2017-01-05 |
| 206 | 932 | 3756 | 2017-01-06 |

Market only
Can you predict where the market will move just by looking at the cryptocurrency exchange activity? Let's find out. I'll be doing my work in R but you can use any other scientific computing tool to replicate the analysis.
First, let's split our dataset into the train and test parts.
df_train <- market_data[market_data$date < as.Date('2017-06-01'), ]
df_test <- market_data[market_data$date >= as.Date('2017-06-01'), ]
df_train <- plyr::arrange(df_train, date)
df_test <- plyr::arrange(df_test, date)
df_train$date <- NULL
df_test$date <- NULL
We'll use the same validation for all the models in this analysis so we can compare which approach yields best results.
# Select the best model using RMSE (root mean square error) metric
rmse <- function(actual, predicted, metric_params = list()) {
  sqrt(mean((actual - predicted)^2))
}

validate <- function(model, actual_price, test_data) {
  predicted_price <- as.numeric(predict(model, test_data, type = "response"))
  rmse(actual_price, predicted_price)
}
Let's see how our model performs without any preprocessing or feature engineering. We'll use these numbers as the baseline for future improvements.
library(glmnet)
y <- market_data$close[2:152] # tomorrow's close price
x <- model.matrix(formula('~.'), data = df_train)
test_data <- model.matrix(formula('~.'), data = df_test)
model <- glmnet::cv.glmnet(x, y, nfolds = 10)
print(as.numeric(predict(model, test_data, type = "response")))
# [1] 215.9646 217.4369 218.0105 238.0390 241.0313 256.3370 250.2186 253.6602
# [9] 272.8474 326.3172 329.1278 387.3299 383.5536 346.7567 349.5100 357.4449
# [17] 366.2211 358.6208 357.2824 346.7089 325.5524 325.0744 330.2081 312.9617
# [25] 293.4112 264.1955 283.6981 317.0056 293.0575 285.4476
validate(model, actual_price, test_data)
# 24.6687
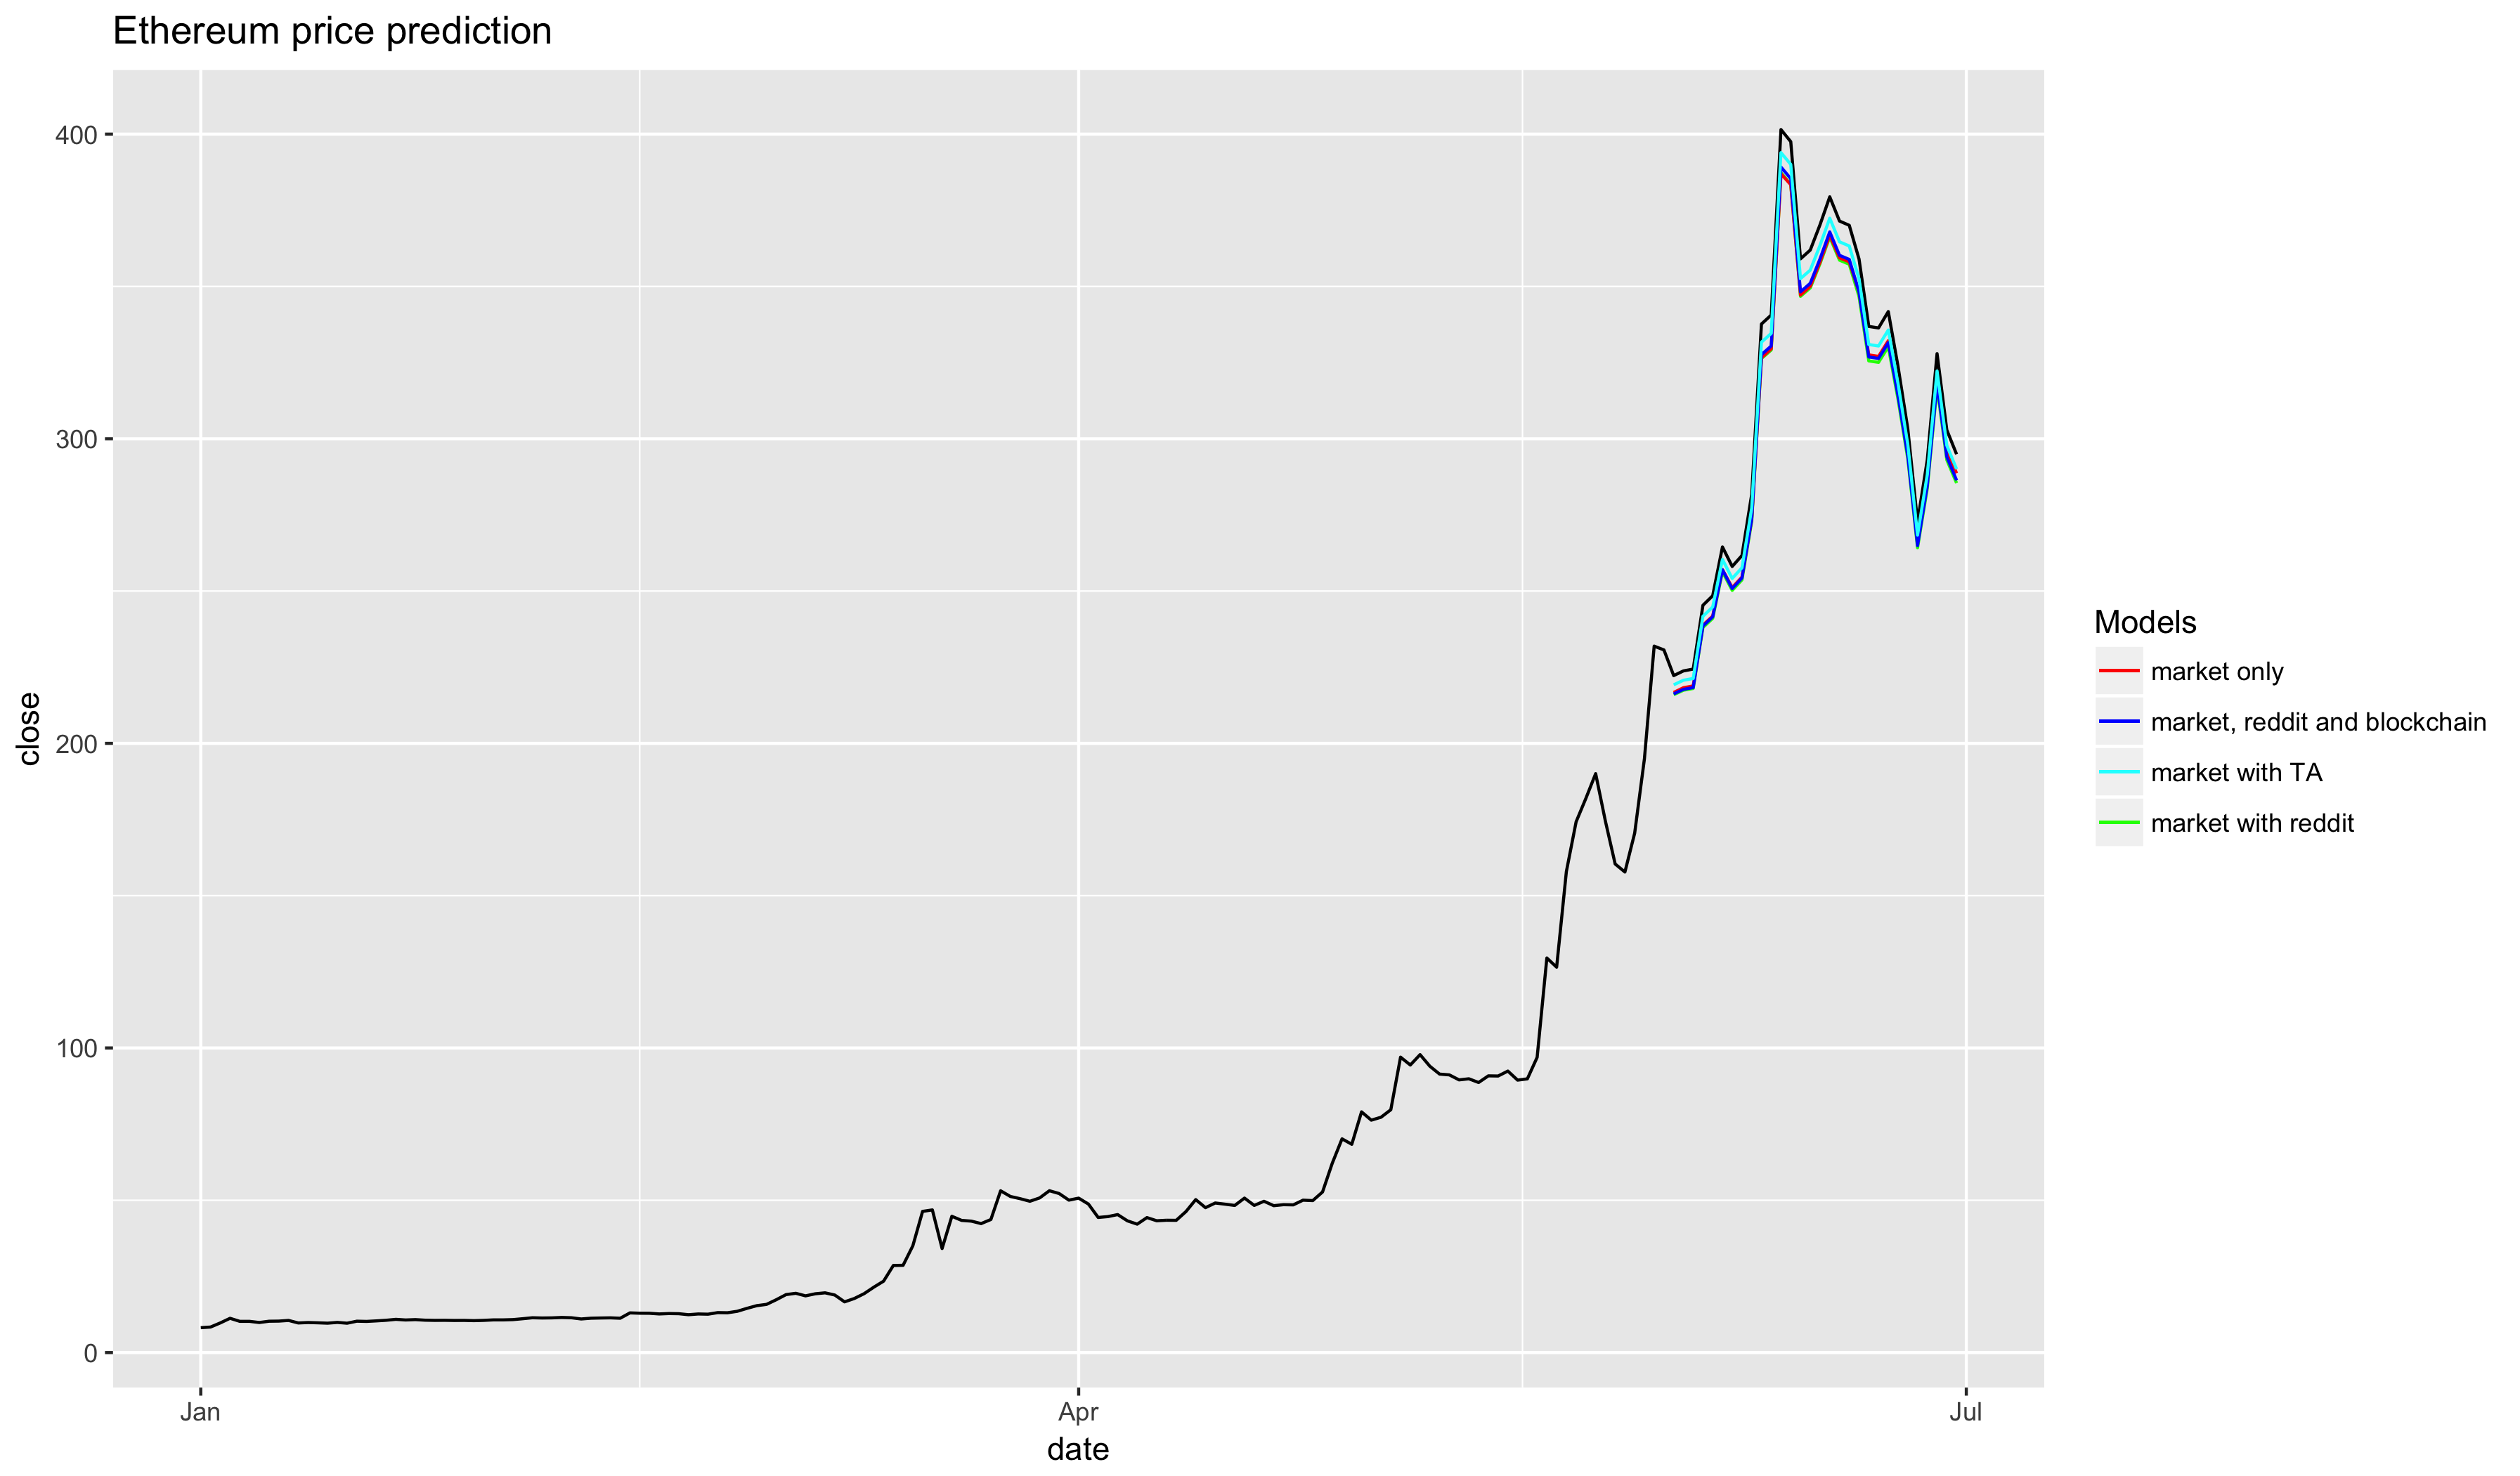
Not bad! Our model, trained on just 151 data points, is capable of predicting the next day's close price with accuracy of around 10-15%.
Technical Analysis indicators
Supervised learning techniques, especially on small datasets such as ours, can only capture simple interactions between the features. That's why in practice analysts spend most of their time doing feature engineering - extracting more information out of the existing dataset. Day traders normally use technical analysis to predict where the price will move. Let's mimic them and add some indicators to our dataset.
library(TTR)
market_data$SMA_7 <- SMA(market_data$close, n = 7)
market_data$SMA_14 <- SMA(market_data$close, n = 14)
market_data$EMA_7 <- EMA(market_data$close, n = 7)
market_data$EMA_14 <- EMA(market_data$close, n = 14)
market_data$RSI <- EMA(market_data$close)
market_data$ATR <- ATR(market_data$close)
market_data$CMO <- CMO(market_data$close)
And let's repeat the above procedure to train and validate the model.
print(as.numeric(predict(model, test_data, type = "response")))
[1] 216.2337 217.7196 218.2986 238.5130 241.5331 256.9809 250.8056 254.2792
[9] 273.6445 327.6107 330.4475 389.1899 385.3786 348.2400 351.0189 359.0275
[17] 367.8852 360.2143 358.8635 348.1918 326.8388 326.3564 331.5378 314.1312
[25] 294.3993 264.9123 284.5960 318.2127 294.0423 286.3618
> validate(model, actual_price, test_data)
# 24.25081
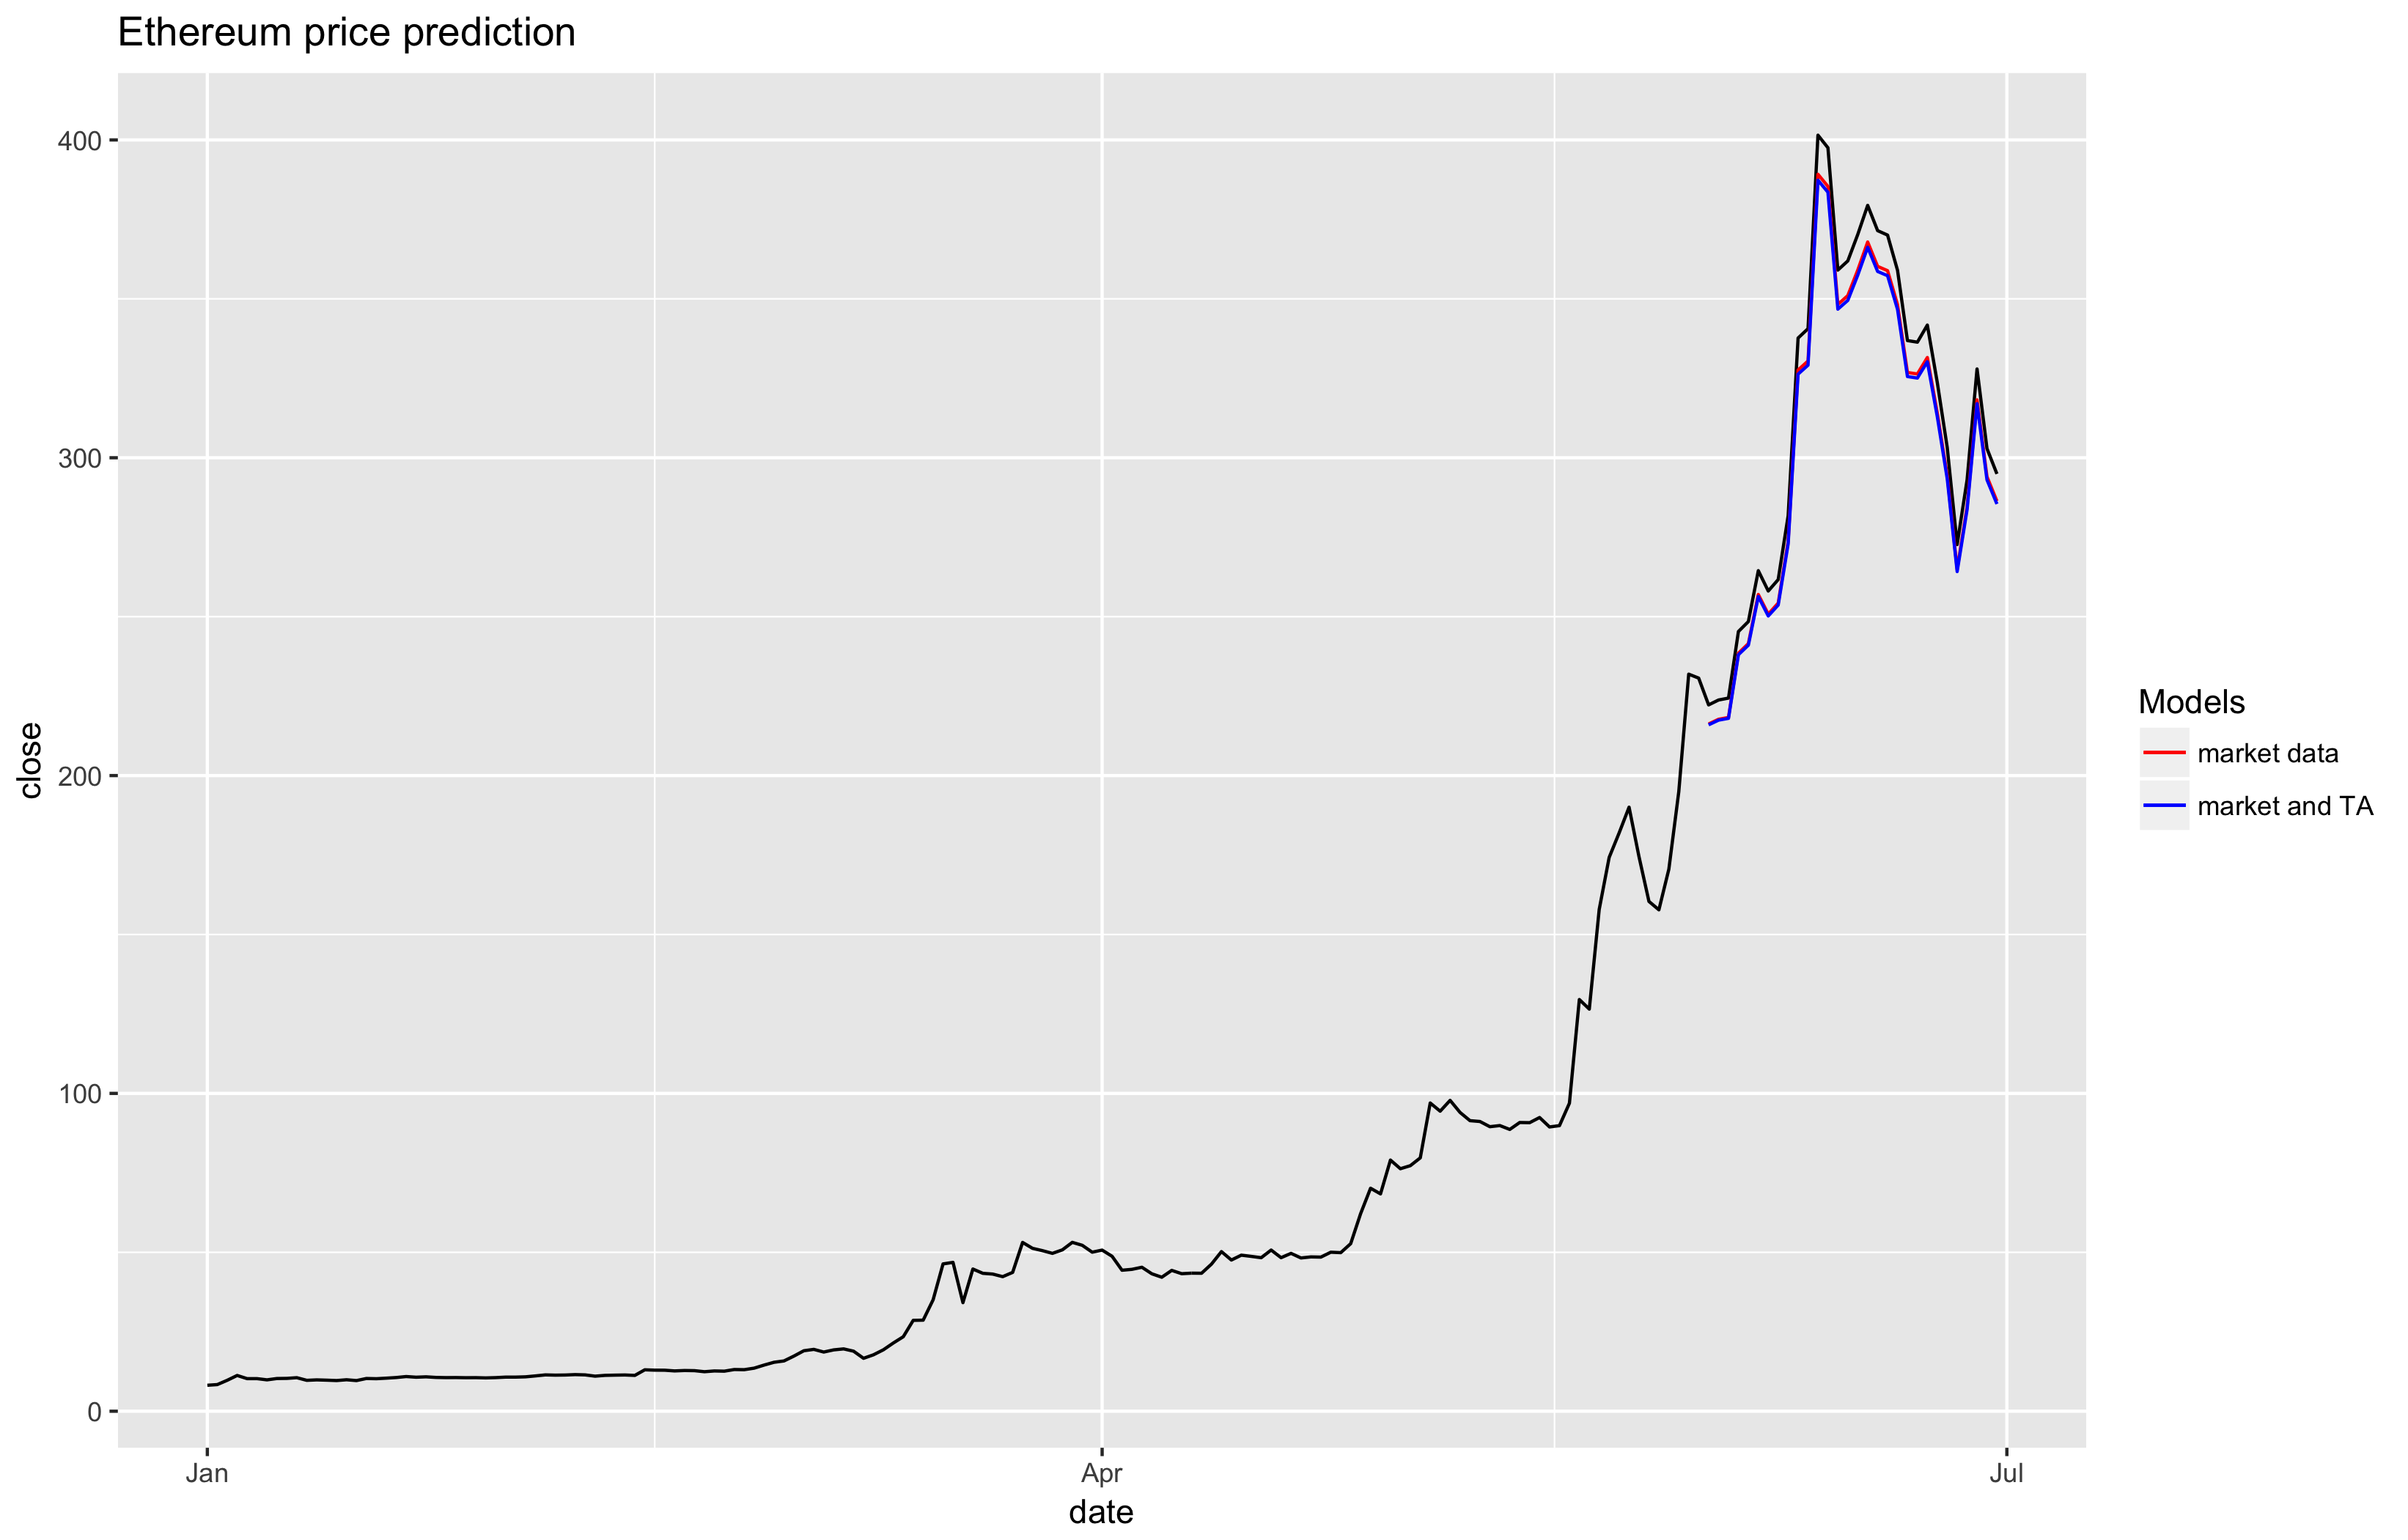
Well, looks like our predictions did get a little bit better, but not by that much, and, unless you know what you're doing, it's not worth it to go through the trouble of calculating them if you're only interested in predictions for the next day.

Market and community
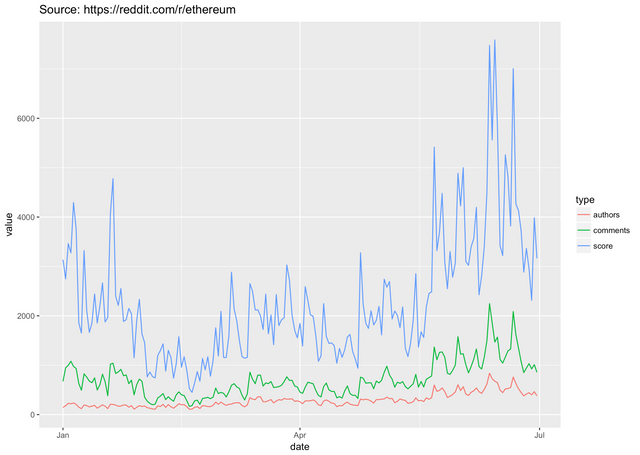
Let's augment our dataset with some community activity data. Obviously, the more you can capture the better, but for this toy example we'll only use reddit. I've scraped reddit.com/r/ethereum, loaded the data into Google's BigQuery, and calculated number of unique authors, total number of comments and sum of reddit's upvotes for every day of the first six months of 2017. Let's see how this data can improve our price forecast.
print(as.numeric(predict(model, test_data, type = "response")))
# [1] 219.2142 220.7151 221.2999 241.7176 244.7681 260.3713 254.1339 257.6425
# [9] 277.2025 331.7115 334.5768 393.9101 390.0604 352.5483 355.3552 363.4443
# [17] 372.3911 364.6430 363.2786 352.4996 330.9319 330.4446 335.6781 318.0965
# [25] 298.1660 268.3825 288.2642 322.2190 297.8054 290.0477
validate(model, actual_price, test_data)
# 23.90929
And it looks like reddit's data does help out quite a bit, reducing prediction error by another 1-2%. One interesting thing to notice is that our model seems to be a little pessimistic about ethereum - it always predicts a price point that's slightly lower than what it ends up being in real life.

Market, community and blockchain activity
Blockchain activity is the closest proxy for ethereum's intrinsic underlying value. Whoever learns to extract the most useful features from the blockchain is going to get a competitive advantage on the market. Let's see how well the features extracted by etherscan perform.
> print(as.numeric(predict(model, test_data, type = "response")))
 [1] 216.7070 218.2707 218.8475 238.8157 241.7886 257.0377 251.1321 254.5985
 [9] 273.5533 326.5697 329.5133 386.9742 383.3900 347.1781 350.0202 357.9327
[17] 366.8018 359.3590 358.0811 348.2106 327.5231 327.0355 332.1820 315.1972
[25] 296.0067 267.2914 286.6157 319.6879 296.1254 288.6802
> validate(model, actual_price, test_data)
[1] 24.28866
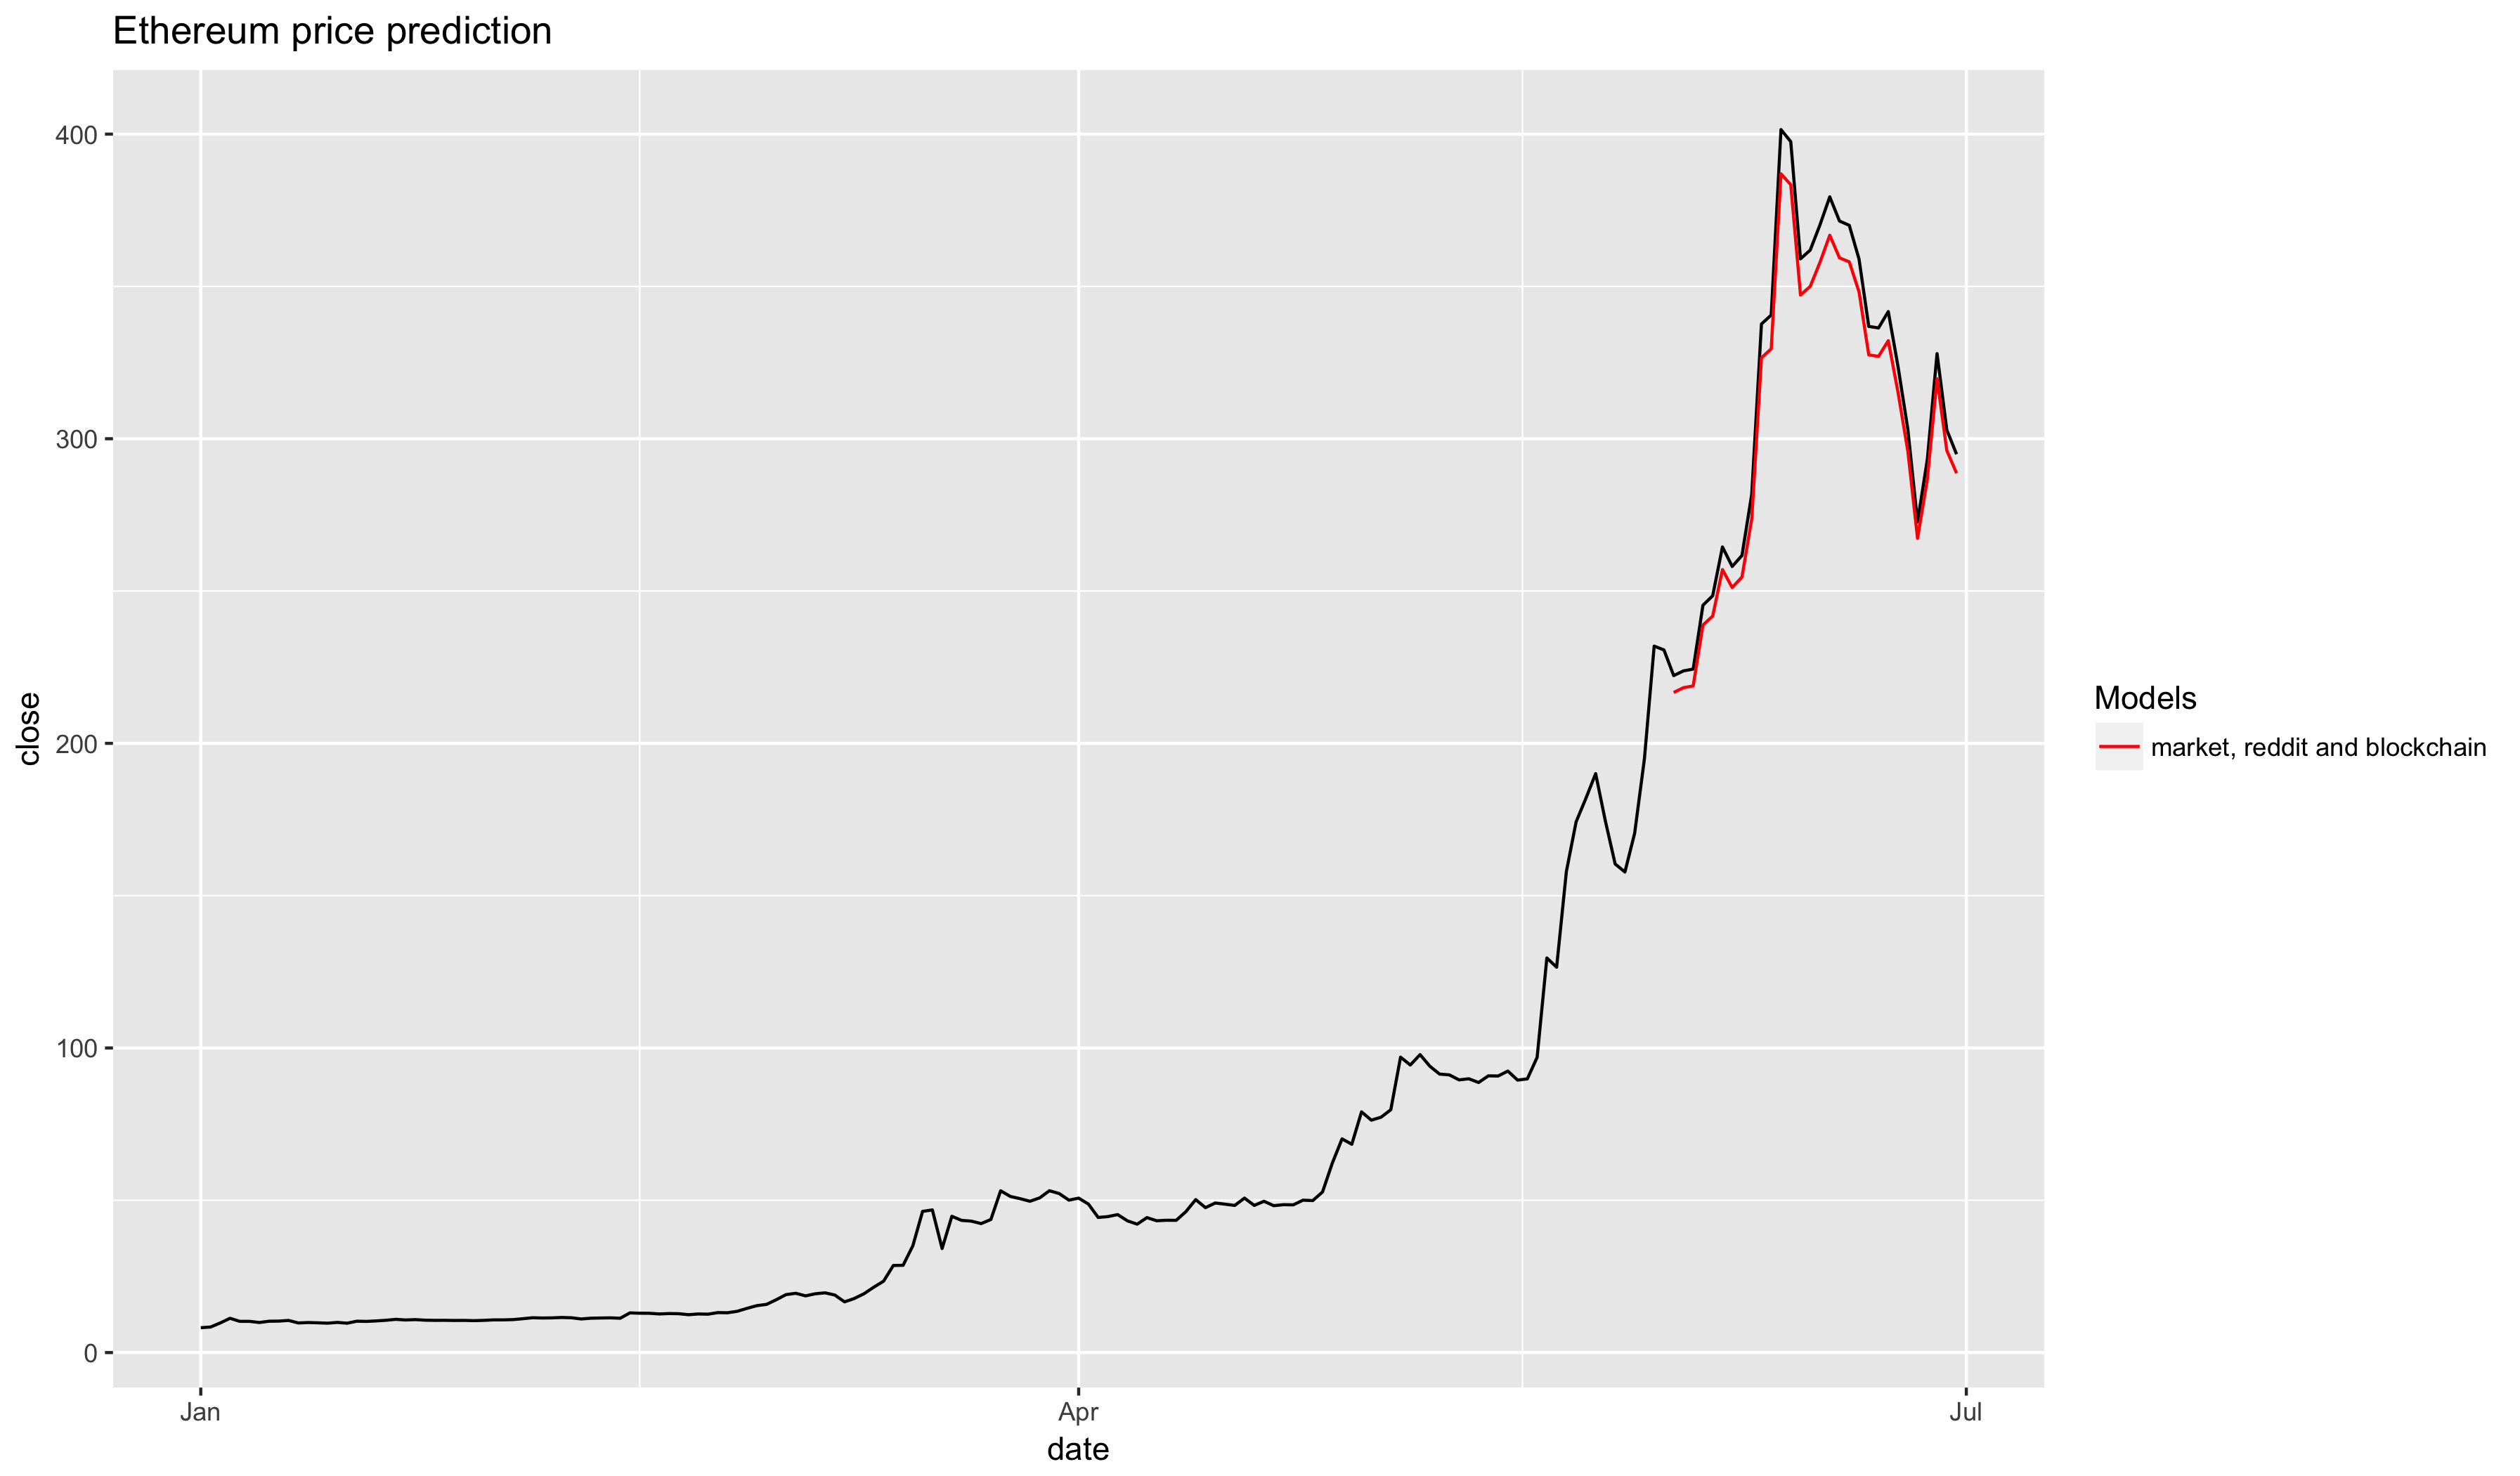
And we arrive at a surprising result! Not only did more data not make our model better, it actually made it worse! This can be attributed to two factors: we overfit the model (that's quite likely, given how few data points we are working with), and June's ETH price does not correlate well with the underlying blockhain activity, leading me to believe that this particular token was overvalued. And indeed, if you look at ETH's price today it seems to have corrected to a lower value that better reflects its true price.

If you enjoyed reading please subscribe to our blog so that you don't miss our announcements and new posts where we will explore other machine learning techniques and how they can be applied to the world of cryptocurrency. Also, make sure you read through our whitepaper, and feel free to ask any questions you might have or suggest topics for a new blog post in the comments section below.
Good one. 👍
Excellent post! I am working on a similar project and will probably link to this as additional useful info when I complete it.
Ping us in comments when you publish your project, would love to take a look! If you're interested in applying research and statistics to cryptocurrencies you'll love using Rados.
if you Follow & Upvote me, i will Follow & Upvote you...!
Sure, don't upvote just because you like a post. Instead, give them an ultimatum. Brilliant!
That sounds really exciting! Just the kind of activity we've always dreamt of having on our blog
Congratulations @rados! You have completed some achievement on Steemit and have been rewarded with new badge(s) :
Click on any badge to view your own Board of Honor on SteemitBoard.
For more information about SteemitBoard, click here
If you no longer want to receive notifications, reply to this comment with the word
STOPCongratulations @rados! You have completed some achievement on Steemit and have been rewarded with new badge(s) :
Click on any badge to view your own Board of Honor on SteemitBoard.
For more information about SteemitBoard, click here
If you no longer want to receive notifications, reply to this comment with the word
STOP