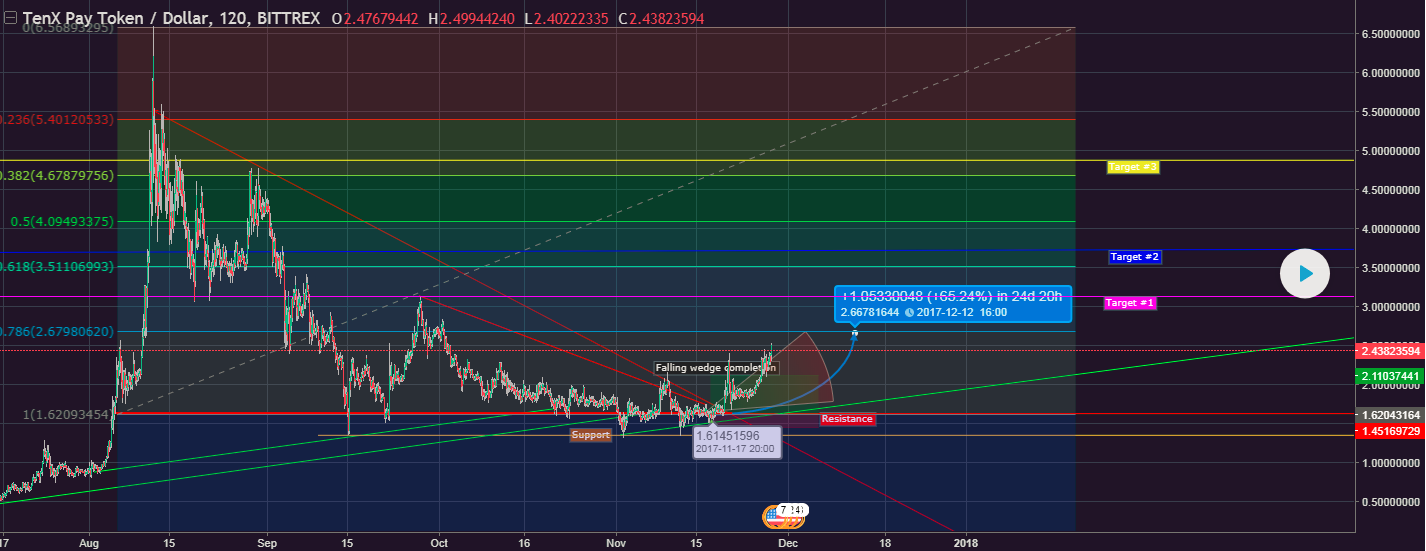
TenX Follow up - Falling wedge profit zones.
Hello guys! Around the beginning of November I noticed the pattern in TenX called the Falling Wedge , and on the 17th Nov. I drew this chart signifying what I believed to be the turning point in TenX/PAY's decline when we seen it's low point of $1.62USD. From this point you can see my projection cone drawn & filled.
The falling wedge is a common reversal pattern indicator - and it can be very profitable pattern to follow when attacked with the right strategy. I have done a follow up to my chart following 3 more solid points of resistance shown within the Fibonacci lines on this chart. These 'Targets' is where I will drop a percentage of my holdings. I will sell a portion (30% roughly) of my TenX holdings at the $3.10 line to start securing my profits. From here I would run a tight stop loss (suggested $2.90 region) & follow the coin up to it's second target of $3.75, where I would drop another percentage of my holdings & wait for the final target lying at the $4.50-$5 mark.
I strongly advise readjusting your stop loss AT THE LEAST at these 3 target points. This being said, to reduce risk & secure profits it is NEVER A BAD IDEA to follow your stop loss - what I mean by this is to watch the coin go from $3.10 > $3.25 & moving your stop loss from $2.90 > $3.05. Using this strategy you would be hard done by to lose money investing in this cycle for TenX.
Here is a link to the TradingView post for a closer look. https://www.tradingview.com/chart/PAYUSD/8yqs9Api-TenX-Follow-up-Falling-wedge-profit-zones/
Here is a link to my Discord channel where I offer expert TA/FA for free! https://discord.gg/WUuTEpC