Chart Patterns

Pattern recognition plays an important role in crypto trading and is an important aspect of technical analysis. A chart pattern is a shape on a price chart that can be used to suggest what a price could do next, based on previous activity. Chart Patterns form the basis of technical analysis and require traders to know exactly what they are looking for and to look for clear patterns in the charts to find good trading opportunities. It's important to know that different patterns do exist, and someone needs to get used to them before you can use them effectively.
Types of Chart Patterns
Continuation Pattern: This shows a break in the trend and indicates that the previous direction will continue after a certain period of time. Examples of extension models are "Cup and Handle", "Ascending Triangle" etc.
Reversal Pattern: These indicate trend changes and can be divided into (up and down patterns). Examples are "Double Top", "Double Bottom", "Head and Shoulder" etc.
Bilateral Patterns: This pattern tells traders that price can move in either direction - meaning the market is very volatile
➟ Looking to get started with cryptocurrency? Buy Bitcoin on
CoinEx
Double Top
The double top is a bearish reversal pattern, a pattern traders use to highlight trend reversals. As the name suggests, this pattern consists of two consecutive tops, almost the same size with a small trough between them.
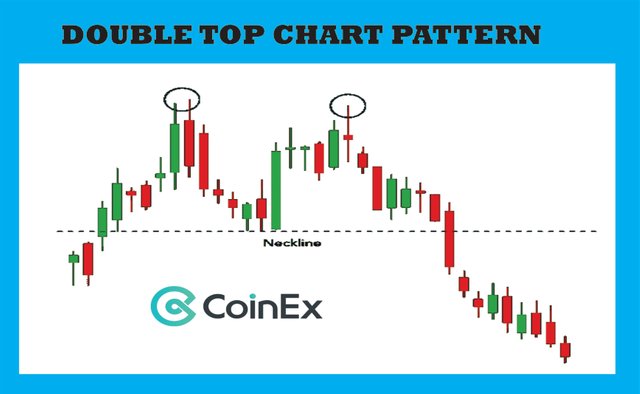
Usually, the asset price will peak before returning to the support level. It will then go up again before permanently returning to the prevailing trend. So before you start trading cryptocurrency, you need to wait for the double peak to be confirmed. Wait for a reassuring break below the cleavage, which is preferably confirmed by an increase in volume. It would be even more conservative to wait for resistance when the price is first tested so that when you test it again, you will have the option to enter the saver, but the price doesn't always test support or resistance after it is broken. So always take note of these things if you want to be a profitable trader.
Double Bottom
The double bottom is an inverted bullish pattern. As the name suggests, this pattern consists of two consecutive bottoms that are approximately the same size with a small tip between them. The double-bottom chart shows the period of sale that caused the asset price to fall below the support level. Then rise to the defense level before falling again. Eventually the trend will reverse and start moving upwards as the market becomes more bullish.
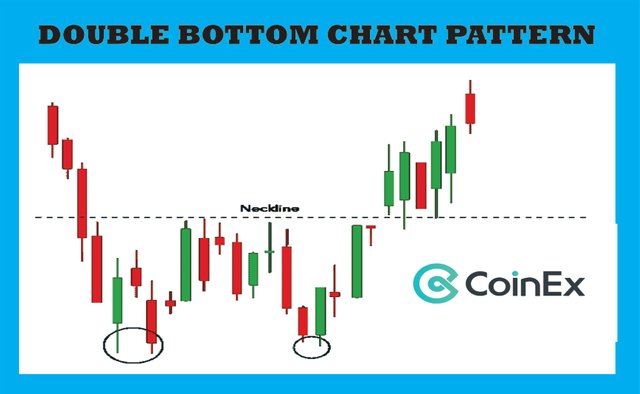
A double bottom is an upside down pattern because it marks the end of a downtrend and a transition to an uptrend. So before taking any trade positions, you need to wait for the confirmation of the double bottom. Waiting for a strong break over the cleavage, which is preferably confirmed by an increase in volume. It will be even more conservative to wait for support when the price tests it for the first time. However, price does not always test maintenance in case of a breakdown on it.
Rounding bottom
The pattern at the bottom of the curve can mean a continuation or a reversal. For example, during an uptrend, the price of an asset may fall slightly before rising again. It will be a bullish continuation. An example of a bullish reversal round bottom is when the asset price is in a downtrend and a round bottom is formed before there is a tendency to reverse the uptrend and enter.
Traders will try to take advantage of this pattern by buying half way through the bottom and profit from the continuation once above the resistance level.
Head and shoulders
Head and Shoulders is a graphical pattern in which a large point has slightly smaller points on either side. The head and shoulders pattern is formed according to the uptrend and shows a trend reversal. Traders look to the head and shoulders pattern to predict a bullish to bearish change. The pattern is easily recognized by three consecutive peaks, the middle or head crest being the highest, and the two outer crests or shoulders lower and roughly the same size.
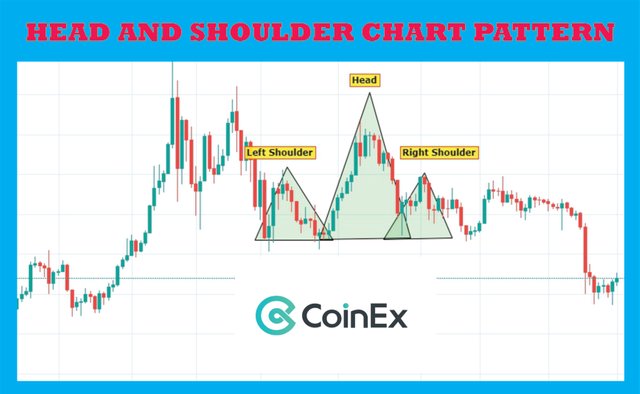
The first and third peaks are smaller than the second, but all return to the same level of support, also known as "cutouts". After the third peak drops back to the support level, it is likely to become a bearish downtrend. The slope of the cut is also an important indicator. When the neckline slopes downwards, it indicates that the price has actually bottomed out just before the right shoulder. The rising section indicates a bullish potential.
Cups and Handles
The cup-and-handle pattern is an upward pattern that is used to indicate a period of bearish market sentiment before the general trend finally continues with a bullish move.
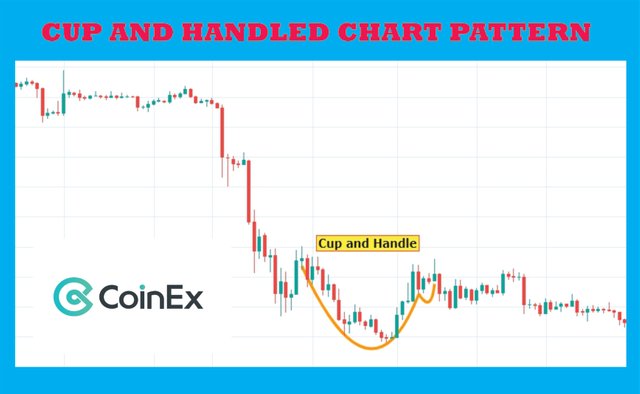
The cup looks like a rounded base diagram and the handle is wedge-shaped. Once the bottom is rounded, the asset price will most likely be adjusted temporarily in what is known as a manipulator because the adjustment is limited to two parallel lines on the price chart. The asset will eventually turn away from the handle and continue the general uptrend.
Wedges
Wedges occur when the asset price movement between two downtrend lines is exacerbated. There are two types of wedges: rising and falling.
The rising wedge is represented by a trend line that lies between the two falling support and resistance lines. In this case, the support line is steeper than the resistance line. This model usually signals that the asset price will eventually fall more consistently - which can be seen when support levels are exceeded.
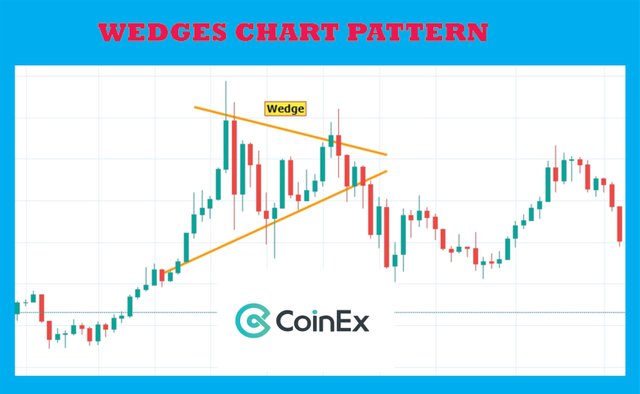
The fall wedge occurs between two inclined levels. In this case, the resistance line is steeper than the carrier. A falling wedge usually indicates that the asset price went up and broke the resistance level.
Both rising and falling wedges are reversed patterns, with rising wedges being a bear market and falling wedges being more characteristic of a bullish market.
Pennants or Flags
A flag or flag pattern is created after the asset has experienced an upward movement, followed by consolidation. In general, there will be a significant spike in the early stages of the trend before a series of smaller ups and downs. Pennant can be bullish or bearish and can be a continuation or reversal.
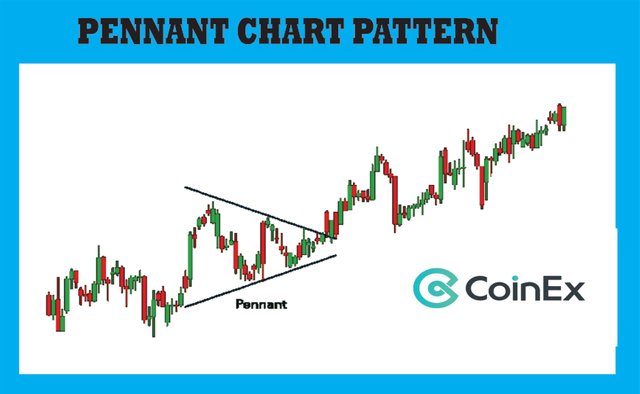
In a bullish continuation chart pattern, the flag can take the form of a two-sided pattern as it indicates a continuation or reversal.
Ascending Triangle
The ascending triangle is an upward continuation pattern, which means a continuation of an uptrend. Sometimes an ascending triangle at the end of a downtrend acts as an inverted pattern, but they are usually known as continuation patterns. The ascending triangle shows us that momentum from pushing resistance builds up when support reaches a higher level.
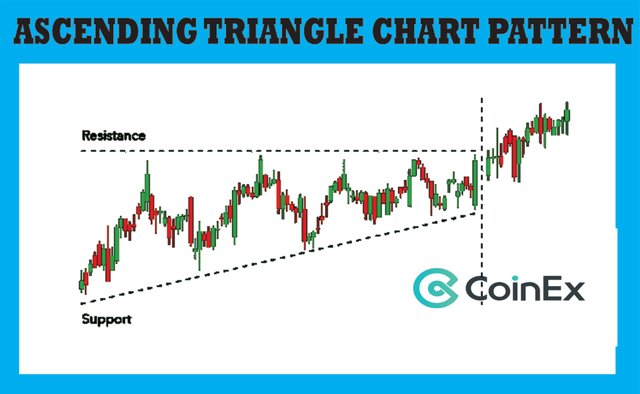
The resistor continues to tilt horizontally as it produces a flat peak. The upper support line consists of at least 2 lows, the horizontal resistance consists of at least 2 highs. The breakthrough must also be confirmed by increasing the volume to have a high probability. Compared to the more symmetrical, more neutral triangles, the ascending triangle is a true bullish pattern. An ascending triangle often has two or more identical vertices that can be used to draw a horizontal line. Trend lines show the overall upward trend of the model, while horizontal lines show levels of historical resistance for a particular asset.
➟ Looking to get started with cryptocurrency? Buy Bitcoin on
CoinEx
Descending Triangle
A descending triangle is opposite to an ascending triangle pattern. The downward triangle means the bearish continuation of the downtrend. The descending triangle can be identified by a horizontal support line and a sloping resistance line. In the end, the trend will break through the support and the downtrend will continue.
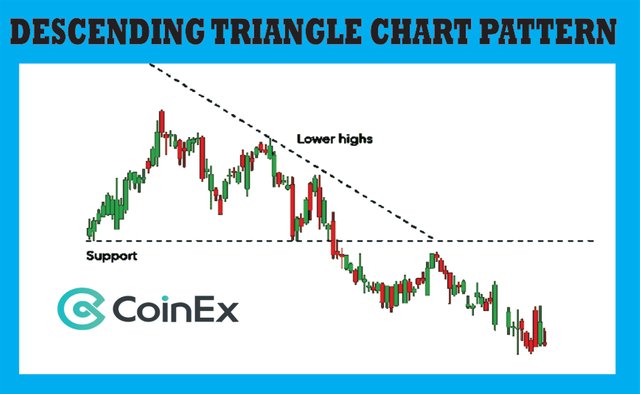
The descending triangle usually moves downwards and breaks support because it indicates a market dominated by sellers, meaning successive lower tops are likely to win and are less likely to reverse.
Symmetrical Triangle
A symmetrical triangle can be a round and a continuation pattern and it can be either bullish or bearish, but it all depends on the market. The symmetrical triangle is a continuation of the market and usually continues in the same direction as the general trend after the pattern has formed.
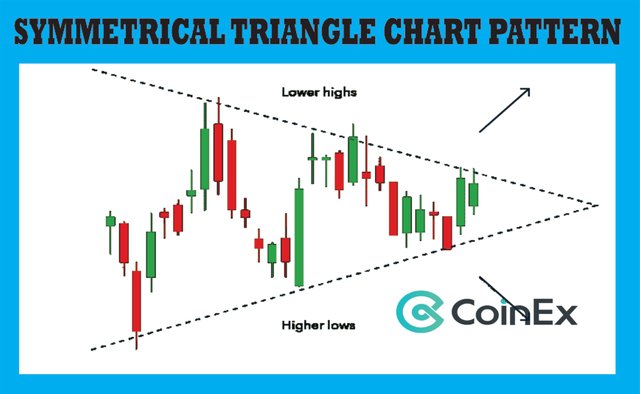
A symmetrical triangle forms as the price approaches a series of lower peaks and higher valleys. In a symmetrical triangle, the direction of the next large move can only be determined after a valid break. As the triangle expands, the price is consolidating, and the triangle is narrowing, you will see volume starting to decrease. However, if there is no clear trend before the triangle pattern is formed, the market may explode in either direction. This makes the symmetrical triangles a two-sided model - meaning they are best used in volatile markets where there is no clear indication of how the asset price may move.
Rectangle
A rectangle is a trading range that acts as a break in a trend. This is often referred to as a continuation pattern because most of the time the trend continues after the rectangle. This pattern can be easily identified by two identical maximum values and two identical lowest values, which are connected to form a parallel resistance and a supporting line or a triangle's top and bottom line. Buyers near support pushed prices up and sellers resistance pushed prices back. This is known as the trading area and is an area where the price is consolidating. Like most patterns, the ends are marked with breaks in the pattern. Volume does not always decrease during rectangle development, as we have seen in other models. Sometimes he just hesitated. However, it is always best to look for confirmed breakthroughs with increased volume.
Price channel
The price channel is similar to the rectangle discussed earlier. The difference is that the price channel is rising or falling and is a real continuation. It consists of an upper trend line acting as resistance and a lower trend line acting as support.
The descending price channel is considered bearish while the rising price channel is considered bullish
- In a downtrend, resistance is the main trend line and parallel support lines are also known as channel lines.
- In an uptrend, support is the main trend line and parallel resistance is called a channel line.
Ideally, the main trend line and channel line is based on 2 highs or 2 lows. Often in an uptrend, traders want to buy near support levels or sell near resistance levels.
CONCLUSION
There is no "best" chart pattern as they are used to highlight different trends in different markets. Some patterns are better suited for volatile markets, others are not. Some pattern are best used in a bullish market, others are best used when the market is bearish. It is therefore important to know the "best" chart pattern for your particular market, as using the wrong chart pattern or not knowing which chart pattern to use can result in missed opportunities. After all, you shouldn't rely solely on chart patterns when entering or exiting the crypto market. On the contrary, it makes sense to combine chart patterns with other independent technical tools that will provide you with the most reliable signals.
➟ Looking to get started with cryptocurrency? Buy Bitcoin on
CoinEx