Marketcap Update – Stardate 05/10/18
Insert witty title here…
Before we dive into a bit of TA (technical analysis) let’s have a quick chat about the overall sentiment. If you want to get straight to the TA scroll down. We’ve been sideways trending for sometime now and the CryptoTwittosphere community is at odds with each other, the obvious two dominant narratives are polar opposites; Super Bullish with expectations of 20k $BTC in 2 minutes and Super Bearish with the expectation of 3k $Bitcoin in 2 minutes.
I theorise that most new comers, and even the Crypto OGs (Original Gangster) have become accustomed to both incredibly large swings up and down as has been the story with Bitcoin’s growth and many altcoins. In a matter of days we’ve seen gains of over 1000%, SO WHY ISN’T IT HAPPENING NOW seems to be the attitude of many traders and investors alike.

We’ve become spoilt brats, we don’t know how to wait nor be patient, this can be seen not only in the crypto community but also in our general behaviour. Smart phones offer instant access to information without any effort on our part and on demand dopamine with flashing games and social media likes. We’ve become accustomed to having our exceptions met, immediately. The market is teaching us a valuable lesson, our expectations are unrealistic.
Analysis!

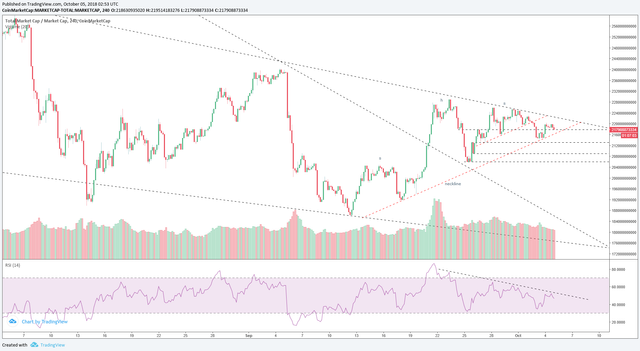
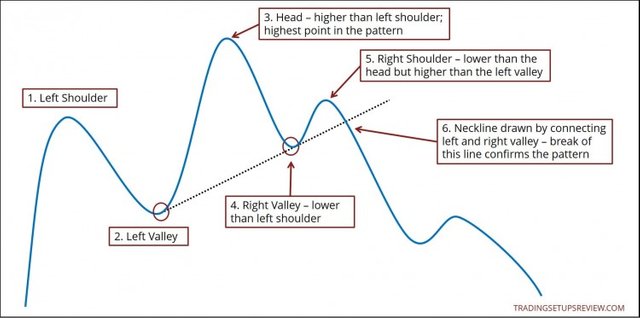
I think it’s safe to say we’ve forming a pretty textbook Head and Shoulders since early September and I’d say there are a lot of eyes waiting to see how this plays out. According to the Head and Shoulders theory the fall of price should the neckline be broken is the length between the head and the neckline, this should see us reach approx $195bn, again.

The neckline I’ve placed on my chart doesn’t follow the above rules, according to the above chart we’ve already broken the neckline which doesn’t bode well for the short term. I’ve place the neckline differently as a point of personal preference as it seems like a more likely point of support.
Volume has been declining since late last month and we’ve seen a rejection on the RSI trendline.
What we’d all like to see obviously is a bullish breakout on both the RSI and the top resistance of the price chart. However I feel that the short term would see us retest at least one of if not all three supporting trendlines and lower should the head and shoulders pattern play out perfectly.
Notes from the editor @TheGayTrader aka FvKnL
Why not keep me going by donating a few Bitcoin satoshi’s (BTC), Cardano (ADA), Stellite (XTL):
BTC:
3J9KJuC3BU7VzMyMegsHPAxu4sXvZwTfxk
ADA:
DdzFFzCqrht1GmkRMxkbKGqynsE4QRjYLbQ9SraJjP5Sj51tDc6iphbWjJRCxLZRZ885tF7jfXXYnfz6VCmVwQNxScVgdSwTZPMW1sGG
XTL: Se4KBWBqJaTMEYvMwS8b5nZaQ2USWzs3nG5FknM1fEqz8XRq56dPxA45e6entubkHh31N4Pos48cAbdJVEFQZF7w1US2bMHKk
Don’t forget to check me out on:
Twitter | InvestFeed | Gab.ai | Bit.Tube | Youtube
Get your cryptocurrencies from…
💲 Coinspot (for Australians): https://www.coinspot.com.au?affiliate=CH9W5
🤑 Binance: https://www.binance.com/?ref=10879807
💰 Kucoin: https://www.kucoin.com/#/?r=1y71c
👏 Cryptopia: https://www.cryptopia.co.nz/Register?referrer=fvknl
Congratulations @thegaytrader! You received a personal award!
You can view your badges on your Steem Board and compare to others on the Steem Ranking
Vote for @Steemitboard as a witness to get one more award and increased upvotes!