BTC/USD. The stock pattern of "An Expanding Formation"

Hello, gentlemen..
The movement of bitcoin price in April is very similar to the stock pattern "An Expanding Formation", which predicts the growth of the asset in the near future.
This is what the pattern looks like.
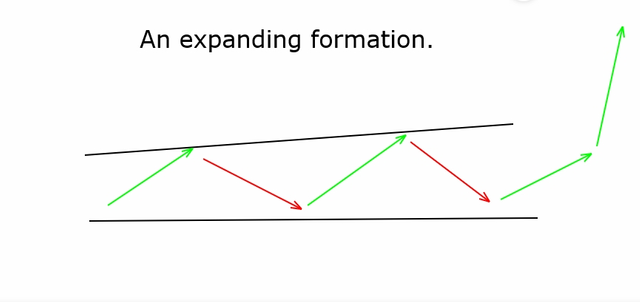
This pattern differs from the "Ascending expanding cone" in that the lower boundary of the pattern is horizontal or close to this position.
"Bitfenix", timeframe 12 hours.
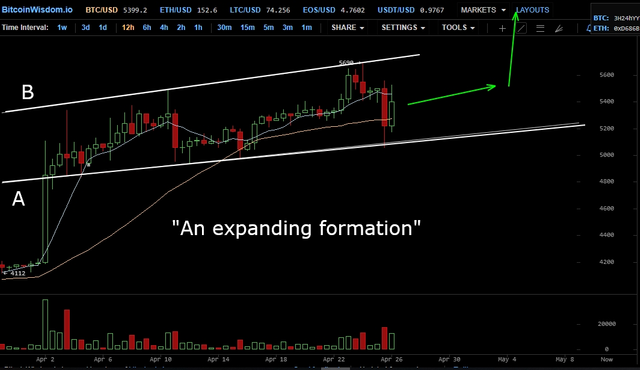
I hope I'm right. In this case, the price of bitcoin in the next week will be at the level $5300 - $5500, with an upward trend.
It should be taken into account that in case of growth, at the level of $6050+/- the price will meet quite strong resistance. The picture will become clearer closer to the start of the increase in the price of BTC.
Good luck!
The @upvoteinvest team
A formal disclaimer
Some of the posts might contain our opinion on trading strategies based on our technical and fundamental knowledge. However, please, invest at your own risk. We can’t be held responsible for any losses
Congratulations @upvoteinvest! You have completed the following achievement on the Steem blockchain and have been rewarded with new badge(s) :
You can view your badges on your Steem Board and compare to others on the Steem Ranking
If you no longer want to receive notifications, reply to this comment with the word
STOPVote for @Steemitboard as a witness to get one more award and increased upvotes!