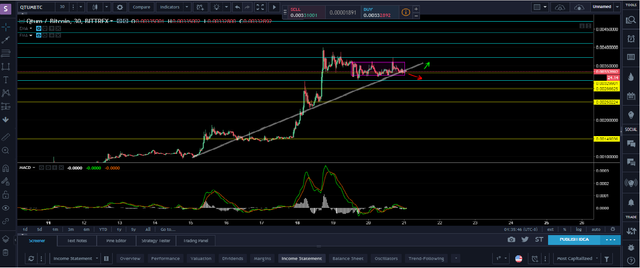
QTUM - NEW ENTRY OPORTUNITY
- Yellow line: This can be resistance or support it depends where is the actual price when you are looking at the chart. Below actual price is support and above is resistance.
- White line:This is bullish trend and also can be support
- Pink rectangle: This is where the price has been consolidating
- Bright blue: Fibonacci tool that has support and resistance lines where the price retraces back and can be use to set you entry or exit point.
Actual price= 0.00332850
Support= 0.00329901
Resistance= 0.00371017
Ideal entry is buying around first support or some Satoshis below, and if this coin breaks support, buy around next support line. Usually when it touches strong support there will be a bounce back. Market is unstable, dont forget to set up stop loss around 5% to 15% or even more it depends of your risk tolerance.
Set targets using Fibonacci tools and remember not to be greedy. Goal is accumulate profits, small profits can become fortune.
Bullish trend still is on, watch volume before taking your position.
BE AWARE OF THE MARKET VOLATILITY & ALWAYS CAUTIOUS WITH BTC!
DYOR and trade at your own risk!
Note: My chart is beginner friendly, and be careful with your comments. 