Solana (SOL) on the Rebound? Bullish Hints or False Hope?
Solana (SOL) is attempting to shake off recent corrections and stage a bullish rally. Let's analyze the technical indicators and potential scenarios for SOL's price movement.
https://coinpedia.org/price-analysis/sol-price-reversal-hints-end-of-correction-rally-to-hit-200/
Current Market Position:
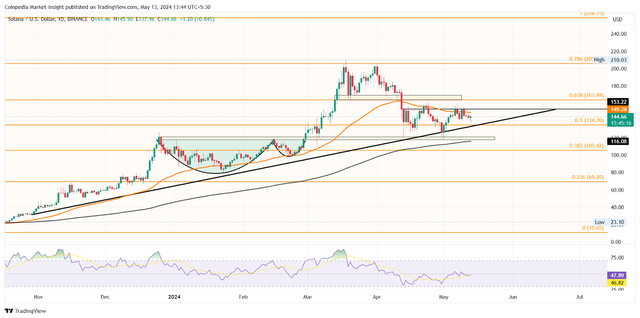
Correction or Reversal: SOL's price has been under pressure recently but appears to be finding support at a key trendline. This could signify the end of the correction and the beginning of a reversal.

Technical Analysis:
Inverted Head and Shoulders Pattern: The chart hints at a potential inverted head and shoulders pattern, often seen as a bullish reversal signal. A breakout above the neckline (around $150) would strengthen this bullish case.
Fibonacci Levels: SOL is currently trading above the 50% Fibonacci retracement level, indicating some buying pressure.
Moving Averages and RSI: The 50-day moving average and the RSI indicator are sending mixed signals. The MACD suggests a potential bearish crossover, while the RSI is struggling to break above the midline.
Potential Price Movement:
Bullish Scenario: A confirmed breakout above $150 could propel SOL towards $200 in the near future. Increased buying volume and a continuation of the current bullish momentum would support this.
Bearish Scenario: Failure to hold above the support trendline could lead to a drop towards the $120 level. This would invalidate the bullish pattern and suggest a continuation of the downtrend.
Broader Market Context:
The overall health of the cryptocurrency market, especially Bitcoin's performance, will significantly influence SOL's price trajectory.
Conclusion:
Solana's price action is at a crossroads. While technical indicators hint at a possible bullish reversal, confirmation is needed. Close monitoring of price movements, support and resistance levels, and broader market trends is crucial for informed decisions regarding SOL.