The Graph (GRT) on the Cusp of a Breakout? Decoding the Triangle Pattern
The Graph (GRT) is hinting at a potential price surge, with its chart formation suggesting a breakout opportunity. Let's delve into the technical analysis and explore the factors influencing GRT's price movement.
https://coinpedia.org/price-analysis/grt-price-within-triangle-teases-breakout-run-to-0-45/
Current Market Position:
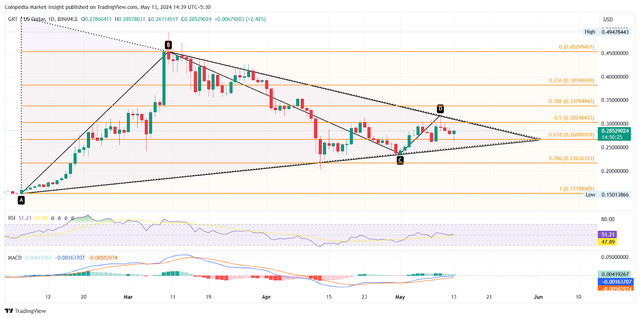
GRT Price Action: The daily chart reveals a symmetrical triangle pattern, a formation that can precede either a breakout or a breakdown.
Technical Analysis:
Triangle Breakout: A bullish breakout from the triangle signifies an upswing in price. The recent lower price rejection during the pullback suggests a potential uptrend towards the resistance trendline.
Trading Volume: A recent surge in trading volume adds fuel to the breakout possibility.
MACD and RSI: The MACD indicator shows a potential bearish crossover, while the RSI remains above the midline. These indicators suggest a possible struggle between bullish and bearish forces.
Potential Price Movement:
Bullish Scenario: A confirmed breakout above the resistance trendline, backed by sustained buying pressure, could propel GRT towards $0.45, potentially reaching the $0.50 psychological level.
Bearish Scenario: Failure to break above the resistance and a drop below the support trendline could indicate a breakdown and a price decline.
The Road Ahead:
Close monitoring of the following factors is crucial for informed decisions regarding GRT:
Price Movement: Confirmation of a breakout or breakdown is essential.
Trading Volume: Continued high volume would support a breakout.
Broader Market Sentiment: The overall health of the cryptocurrency market, especially Bitcoin's performance, will influence GRT's trajectory.