BitShares (BTS) Technical Analysis: Reaching Key Support/Demand Zone

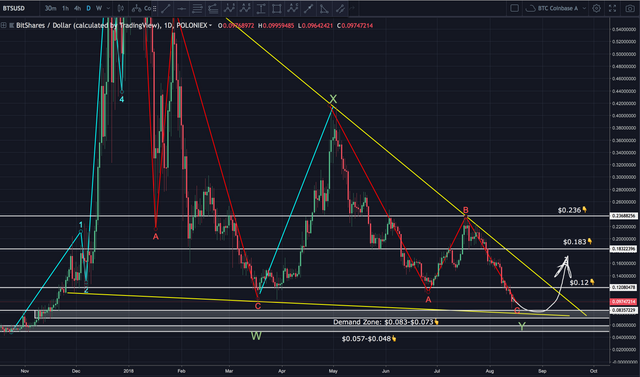
Due to many requests, I’m going to briefly analyze Bitshares. It’s actually looking similar to bitcoin's chart. They both are having complex corrections and both are reaching key support/demand zones. I believe Bitshares is completing wave C of a larger WXY pattern. It’s sitting on top of the $0.083-$0.073 support/Demand zone. It’s also near the bottom of the larger wedge it’s operating in. I wouldn’t be surprised to see price drop 1 more leg down to complete the larger ABC correction. If this happens, I believe a strong bounce is possible.

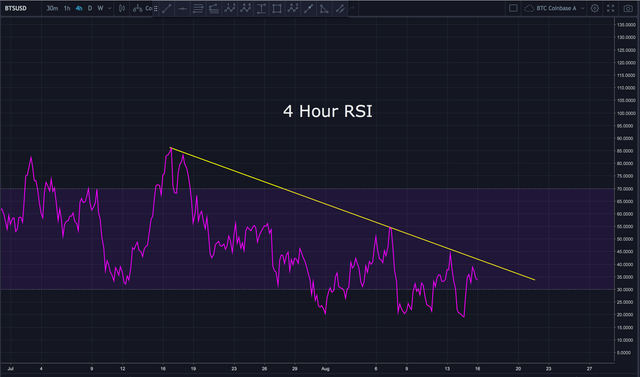
The 4 hour RSI has developed a descending resistance line. If penetrated, that could signify a momentum shift towards the bulls.

In today’s video update, I discuss price movement, give you my bullish Elliot count, review key areas to watch and MUCH more. If you’re not watching my videos, you’re only getting a small part of the story.
Video Analysis:
If you’re viewing this on a site other than Steemit, and you don’t see the above video, navigate to Steemit or TIMM (https://mentormarket.io/profile/@workin2005?aff_id=Workin2005) in order to watch.
BIAS:
Short Term: Neutral
Longterm: Bullish
I hope this has been helpful. I’d be happy to answer any questions in the comment section below. Until next time, wishing you safe and profitable trading!
Workin
If you found this post informative, please:

If you don’t have an account on Binance, I STRONGLY recommend getting one. They’re usually the first to get reputable coins, have excellent security and second to none customer service. Sign up here free of charge: https://www.binance.com/?ref=16878853
Brave is one of the safest, ad free browsers ever created. It helps support the crypto ecosystem by awarding content providers with BAT tokens. Join the revolution and download the latest version here, free of charge: https://brave.com/wor485
Follow me on Twitter (handle is @Workin2005) and Facebook to receive the latest updates. https://www.facebook.com/Workin2005.
MAKE SURE to check out TIMM (Traders & Investors Mentor Market), a STEEM based platform for traders and investors of all levels. Sign up for a free membership and take advantage of the knowledge shared by many investors. You can find the link to TIMM below.
Published on

by Workin2005

Holy crap man thanks so much for this, very excellent TA, probably the best I’ve seen. Very analytical, especially the detail in your video. Way better than Haejins TAs he used to do on BitShares. You’re definitely underrated man and deserve more upvotes, that’s for sure. BitShares doesn’t get a lot of love for some reason so I appreciate this a lot. Thanks.
Thanks for the kind words @bitshareboy.
can you tell me the specific time intervals corresponding to long term and short term ?
Longterm = 12+ months
Short Term = The next 1-3 days