Today's Data Viz Collection #dataisbeautiful (13.12.2017)
Be sure to check in to #dataisbeautiful regularly and tag your viz' with it as well!
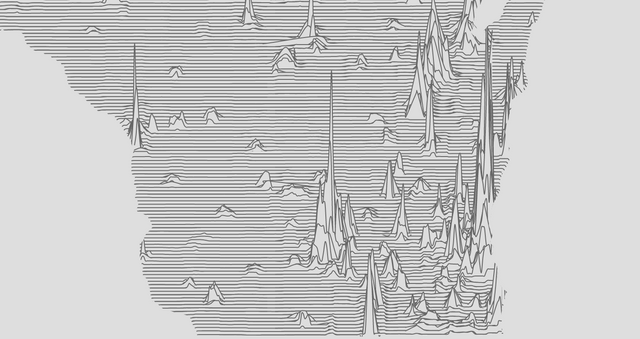
Multivariate Map Collection

What types of maps you can use - so inspiring!
Author: Jim Vallandingham
Carbon emissions from the California fires have spread across the West Coast

One of the most treacherous forest fires in US history, visualised.
Author: /u/Geographist
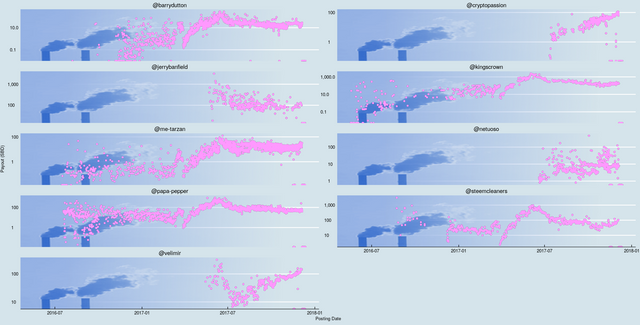
Steem Payout Patterns - December 2017

An fantastic look into how payouts develop over time
Author: @eroche
www.TheReviewIndex.com

"I created a website to visualize and quantify pros / cons for ANY Amazon electronics product, based on its user reviews. It enables readers to go through thousands of reviews in a few minutes."
Author: /u/distant_gradient
Number of bird species throughout North and South America

Authors: Bradford A. Hawkins, José Alexandre Felizola Diniz-Filho, Carlos A. Jaramillo, Stephen A. Soeller
Original Article: http://onlinelibrary.wiley.com/doi/10.1111/j.1365-2699.2006.01452.x/abstract
Congratulations @beautifuldata! You have completed some achievement on Steemit and have been rewarded with new badge(s) :
Click on any badge to view your own Board of Honor on SteemitBoard.
For more information about SteemitBoard, click here
If you no longer want to receive notifications, reply to this comment with the word
STOP