On Taxes & the Wealth Gap
I've been thinking a lot about taxes lately.
I used to not think about them at all. I used to send my income and expenses to my accountant every year, and send whatever he told me to pay to the government. And that was it.
No tax planning. No attempts to lower my taxes. Other than the standard RRSP that we all get, I really didn't think too much about it. Didn't think it was too high. It seemed quite reasonable actually.
As my income has increased over these past 5 years, I've had to think a bit more about taxes. And this year, 2020, the amount of time I have spent thinking about taxes has reached a new level.
Over the years, we've all heard stories about what “the rich” pay in taxes. Mitt Romney famously paid a 14% effective rate on his taxes, on $42 million income. Some said he actually didn't take a few deductions he was legally allowed to, otherwise, that tax rate would have been 12%.
We're reading about Donald Trump paying no taxes for 10 out of 15 years, and $750 for 2 of the 5 years he has paid taxes.
Lest you think I am picking on the Republicans, Bernie Sanders paid 26% taxes on his $500K income. And Biden paid 31% on his $1 million income. Oh. That's actually a lot higher than Trump and Romney. But neither of them are business owners. It's business owners and investors that get to save on their taxes, as we'll see below.
(But anyway, show me a Democratic or Republican business owner making $10 million or more, and I'll show you a low effective tax rate.)
It's fair to say that the richest 1,000 people in the United States all pay in that range of 10-20% in taxes, and quite a few are 0%. Almost none are in the 50% range you would expect for the top tax bracket.
It's not for me to say if that's fair or not. If you make $3 million per year, even 10% of that is still $300,000 in taxes which is quite a lot. When we talk percentages, we're ignoring a large amount of real money being paid. But when we talk about dollars, we're ignoring the relative percentage. I guess we need to always talk about both.
So I ask myself, at what point does the switch flip when you go from paying 50% of your income in taxes back down to 10%? What's the path? How do I get from 50% to 10%? And that's an interesting rabbit hole I've started to go down.
Besides the taxes they pay, some people marvel at the size of the gap between the rich and the poor. There are many ways to look at that.
You hear that:
- the average CEO salary is now 227 times that of the median worker
- the richest 1% of people own more than 50% of the world's wealth
- the richest 0.01% of people (1 in 10,000) own more than 11% of the wealth
There are so many ways to look at that.
I think I have some insight on this. For some, you already know this. For others, maybe you don't. And my hope is that by stating it plainly, it will begin to make some sense.
For the income tax story, there are two factors at work here:
- The government taxes “salary / income” at the highest rates, and there are very few useful deductions.
- The government taxes “business / investment income” at the lowest rates, encouraging people to start businesses or invest in them.
Makes sense hopefully. I mean, Robert Kiyosaki said this in the book Rich Dad, Poor Dad all those many years ago.
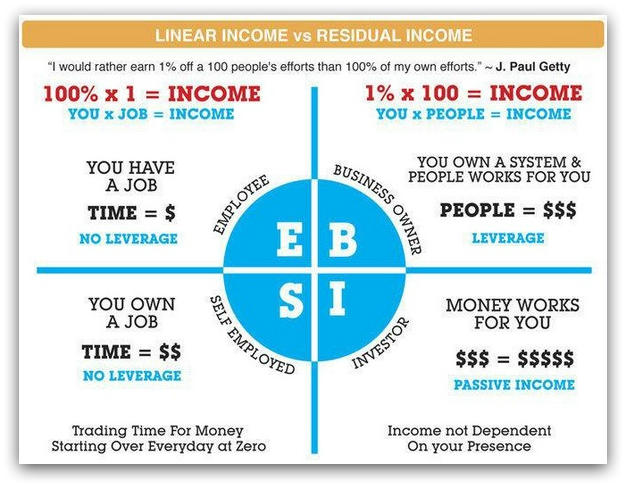
Figure 1
So the left side of this quadrant is taxed at the highest rates. And the right side of this quadrant is taxed at the lowest rates.
So far so good. So we should not be so surprised when Mitt Romney earns $40 million and only pays $5.5 million in taxes. He doesn't have a job. He doesn't work by the hour. All his money is on the right side of this.
I knew this before. No surprise.
The thing that really clicked for me this year was how the above diagram affects wealth.
Now let's switch topics for a second and talk about inflation. What is inflation?
The government measures it as the rate in which prices rise. But how do you even measure that?
It's very difficult. The national economy is big and complex. The data governments have is selective, skewed and imperfect. The cost of a basket of groceries in New York differs from the cost of the same basket in Dayton, Ohio. Add to that, we have Chinese-built electronics like flat-panel TVs which fall in price every year. Stores run sales. People can price shop online. People (like me) buy 5 packs of toilet paper when it's $4.99 and don't buy it at all when it's $12.99.
Have you noticed that manufacturers are clever too? That chocolate bar is smaller this year than it was 10 years ago. The package of cheese weighs less. They now wash and chop the lettuce for us, add in carrots and croutons, and sell it in a bag ready to go. I mean, who buys whole heads of lettuce these days? Certainly, fewer people do.
I will say that it must be very difficult to measure such a complicated thing.
I don't actually think they do an accurate job of measuring it. At least it doesn't seem to me that it's possible that inflation is currently only 1.8%.
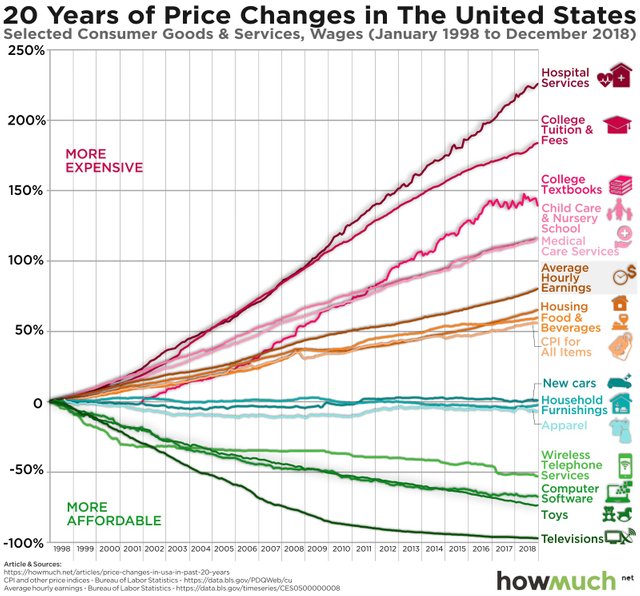
Figure 2
The government wants to show that the cost of some things has gone up, and the cost of some things has gone down, and therefore overall inflation is only 2%.
Has the cost of a mobile phone really gone down more than 50%? My last phone (Google Pixel 3 XL) cost $1,250. My first Pixel XL, three years ago, was only $1,050. That's 20% higher in price!
Ahhhh, there's the trick. The government knows that the mobile phone I own is WAY more powerful than the one I bought 3 years ago. So they count that in a funny way. If the Google Pixel 3 is “twice” as powerful as the Google Pixel 1, it's worth twice as much, and since I only paid 20% more, I actually saved 40% on the cost. That's considered a price decrease to them.
But it's not. My new phone cost 20% more than my last one. Not less.
Are they talking about the monthly cost of my data plan? I pay $150 per month for two mobile phones! Maybe they think I get 10GB of data per month, with is 10 times what I used to get, so the mobile phone plan is now cheaper than it was. Even though it's more expensive.
Think about your TV. The chart above says the price of a TV has fallen 95% in the past 20 years. Has it? What did you pay for a TV in 2000? What is the cost today? It's not that much different. Certainly not 95% less.
My last TV was $500. I promise you I did not pay $10,000 for one in 2000. So the above chart is more “funny math”.
The house that I live in has doubled in price in the past 6 years. News articles claim that young people can't afford to live inside the city of Toronto anymore. What I paid for rent 10 years ago has doubled. The true cost of housing has skyrocketed in the last 10 years. Oh, but interest rates have fallen. And kids are staying at home with their parents longer. So they can count that as almost no increase…
What about the cost to drive? Are car prices lower? The cost of gasoline is higher. The cost of car insurance, for me, has doubled. Car repairs are pricier. Parking downtown is super expensive. What part of car ownership is cheaper? None of it.
So inflation is a bit of a trick. #fakenews
So many things in society are tied to inflation. Tax brackets. Elderly pensions. Salary increases by employers. Interest rates.
When inflation is 2%, and the average annual salary increase is 3%, you might think employers are being generous giving people salary increases above inflation. But it only is generous is inflation is really 2%. Which it probably isn't.
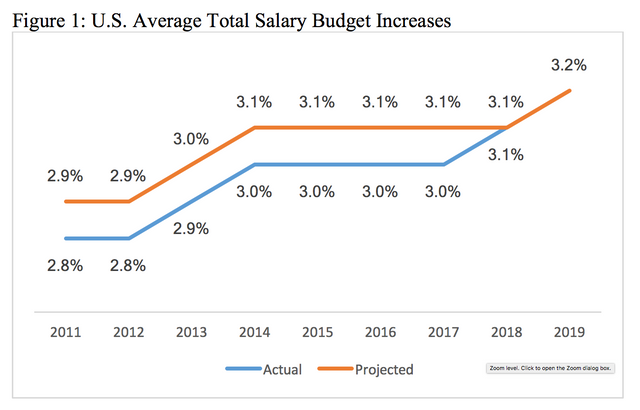
Figure 3
The average salary increases are around 3%. Which is barely ahead of inflation, so the net salary increase is 1% or perhaps even declining if you don't believe inflation is really under 2% per year.
Salaries are not really increasing.
That's the “employee” and “self-employed” quadrants on Kiyosaki's chart at the top of this article. Employees pay the most in taxes, and their salaries do not actually increase year after year. Unable to save. Unable to build wealth. Unable to afford to own a home in a major city.
So what about the business owner and investor class on the right side of the quadrant?
The S&P 500 has returned an average of 13.6% per year in the past 10 years.
The percentages here are not new information, right? We all expect stocks to return 10% per year on average.
And that's just the public stock market.
What about investing in companies that are small? Seed stage? Venture capitalists? Are they making only 10% return on their money? No. They want 10X return on their money in 7 years.
Think about the average business owner that has not accepted outside investment. Say you make money by buying a product for $5, and selling it for $15. You have expenses of course, but you make a $5 profit for every item you sell. It costs you $5 to make and $5 to sell. That's 50% return on your money.
And then you do that again. And again. And again. How many times can you buy an item, sell it, and buy another in a year. What is the velocity of that money?
Let's say you can do that 8 times in a year. You start the year with $10 to make and sell a product, and you end the year with $40. That's 400% return on investment in a year.
So the business owner is getting 400% return on investment. The stock holder is getting 10% return on investment. And the worker gets a 0% salary increase.
Do you see where this is heading? In 5 years? In 10 years? In 20 years? Where does the business owner, the stock holder and the employee end up?
I think it's the difference in returns that really strikes me the most.
Class of person, Average increase per year
- Employee, 0% salary increases
- Stock market investor, 10% stock market increases
- Private investor, 25% investment increases
- Business owner, 100% return on capital
Salaries are taxed the most with very little ability to escape them. And investments & businesses are taxes the least, with tons of ways to defer the taxes or even avoid them entirely.
(Let's not even mention the true global multi-national corporation. Starbucks, Google, FB, Apple, and the like pay 1% or lower tax rate on their earnings because they can legitimately move money around the world to the countries that won't tax them on it.)
And so if you take the period of 1990 till today, 30 years, the difference between a 1% increase over inflation (employee), an 11% increase above inflation (stock market investor), and 98% increase above inflation (business owner) has created the wealth gap.
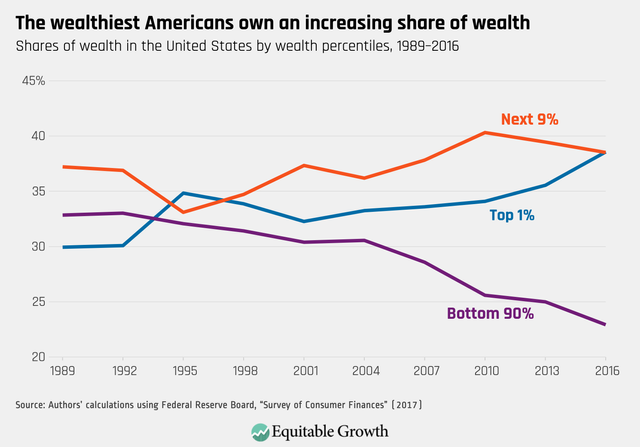
Figure 4
The top 10% has increased their wealth by trillions of dollars, while the bottom 90% has not increased theirs at all.
One can even argue, that the business owners have decided to keep 100% of the wealth gains of the country to themselves and not share any of it with their workers.
.png)
Figure 5
Effectively, since 1990, the after-inflation family incomes have stalled out.
I'm not a socialist. I'm not trying to take the money from the rich and give it to the poor. Just stating the facts here.
I do believe, however, that this situation will have to change someday. You can't have all of the benefits of a society going to a few people while the majority of the people tread water. One day, something will happen.
But there it is, in black and white.
You can't “work” your way from the bottom 90% to the top 10%. (Unless you're an athlete or an actor, perhaps.) But even then, you can't work your way into the top 0.1%.
If figure 5 remains true, if real wages haven't changed in 30 years, and won't change in the next decade either, then figure 4 will remain true too.
The rich get richer. Q.E.D.
Get ready for that "SOMEDAY"... It's on Approach Now...
October 4, 2020... 16.6 Hollywood Time...