Supply-Demand Graph: An overview
Summary
- The supply-demand graph is the center of how an economic system and a free market works.
- Demand is the given quantity of products consumers are willing to and able to purchase at a given price, in a given period of time.
- Supply is the quantity of products sellers are willing to and able to sell to customers at a given price, in a given period of time.
- When the supply and demand curves are both place on the same graph, the equilibrium is where both these lines intercept. When the products being supplied into the market equals the amount of products being demanded.
Introduction
The supply-demand graph is the center of how a free market works. It can be used as a visual aid to determine the effect of most market factors on the price and quantity of a good or service (we will use 'product' interchangeably with goods and services).
Demand
Figure 1

Source: Hayes n.d.
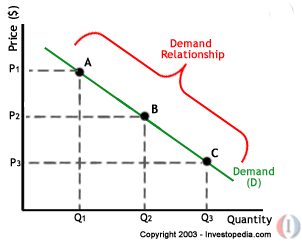
Demand is the given quantity of products consumers are willing to and able to purchase at a given price, in a given period of time.
Generally, the higher the price of a product, the lower the demand for that product. This is because as the price increases, less and less people will be able to purchase that same produce at a higher price. This also occurs vice versa (i.e. the other way around).
Some factors that will affect demand for a product are as follows (these factors also work vice versa)
- Income: The more money someone has, the more they are able to purchase a certain product.
- Price: Generally, the lower a price of a product, the more the demand for a product will increase. There are three relationships between two or more products. Substitutes products are products where a change in price of one product will change the demand for another similar product (i.e.one product can be substituted for another product) (eg. white bread and wholemeal bread). Complementary products are products that rely on each other in some way and are usually purchased together (eg. printers and ink cartridges). Unrelated goods are those where a change in one product does not create a change in another product (eg. petrol and ice cream sales).
- Type of product: There are three general product types. Normal products are products where the demand increases when the price decreases (eg. shoes). Inferior products are products where a decrease in price will decrease demand, because people have more money to buy a less inferior product (eg. homebrand bread vs normal brand bread). Exclusive products are products where the increase in price will generally increase the demand of a product, generally this is associated with a certain look of a product, (eg. an iphone may increase demand if the price is increased due to its exclusivity and marketing).
- Income distribution: How much money parts of the given population have (eg. there will be a lot less people to buy expensive cars in Thailand than in the United States).
- Seasonal changes: The effect of seasonal changes on supply and demand (eg. watermelon season in spring and summer mens there are more picked, therefore these are sold at a lower price due to the increase in
Supply
Figure 2

Source: Hayes n.d.
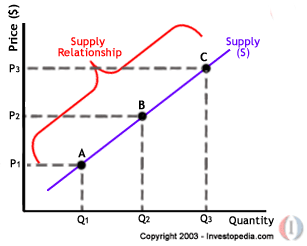
Supply is the quantity of products sellers are willing to and able to sell to customers at a given price, in a given period of time.
Generally, the higher the price of a product, the higher the quantity of a product a supplier will desire to produce. This is because producers will raise more revenue by selling a greater quantity of a given product at a higher price. This also occurs vice versa (i.e. the other way around).
Some factors that will affect supply for a product are as follows (these factors also work vice versa)
- Costs of production: The more it cost to produce a product, the greater the increase in the price a supplier will demand for that product.
- Cost of substitute products: The cost of creating one product over another (eg. if more revenue will be made by making metal chairs instead of wooden chairs, then a supplier will supply more metal chairs to be sold).
- Technology: Generally, the greater the technological efficiency, the greater the increase in supply of a product.
- Government intervention: The amount the government may limit or increase the supply of a product to a market (eg. Taxing cigarette production means less cigarettes are supplied to the market and their price also increases, both due to the cost of production). This is general in order to keep certain products cheaper for buyers.
The Equilibrium
Figure 3

Source: allBusiness n.d.
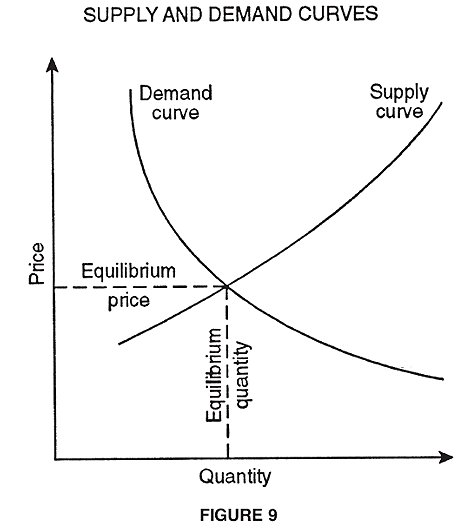
Both the supply and demand curves will have a point of intercept on the graph. This point of intercept is where the market is said to be at equilibrium. The products being supplied into the market equals the amount of products being demanded. At equilibrium, all buyers are buying all the products they are demanding and all the sellers are selling all the products they are producing. Nothing is wasted, hence everything is at equilibrium.
Of course, in practice, this is not always the case. Suppliers will generally try to make as much revenue as they can. Buyers will generally try to purchase products as cheaply as they can. The market is essentially a struggle between buyers and sellers to agree to a deal that both will agree upon to exchange a product for a price.
One part of the supply-demand curve in Figure 3 to note, the demand curve is concaved towards the top right of the graph, and not straight. It is not straight. Because, generally, no one will produce a certain amount of a product and sell it for free (i.e. the price = 0). Similarly no buyer will generally purchase a product at a price and receive no product (i.e. when quantity = 0)
Sources
- Hayes A, n.d., 'Economics Basics: Supply and Demand', Investopedia, retrieved 26 June 2017, http://www.investopedia.com/university/economics/economics3.asp.
- allBusiness n.d., 'supply and demand curves, supply and demand equilibrium, 'allBusiness', retrieved 26 June 2017, https://www.allbusiness.com/barrons_dictionary/dictionary-supply-and-demand-curves-supply-and-demand-equilibrium-4958000-1.html.