Feb 04 2018(Time: 20:00 UTC): ETHUSD is NOT a buy based on Volume Profile Analysis
This post is a continuation of my previous post on ETHUSD titled Jan31 2018(19:00 UTC): ETHUSD is NOT a buy due to bearish flag/wedge formation(continuation of downtrend)
For the next few days, I think its best to first look at daily charts to confirm a bullish trend and then enter market for 15 min quickies. I would not take longs, until and unless, 20MA is moving upwards.
Since Jan 09 2018, the volume indicator OBV has been in a downward trend. Even though the price improved, it has been resilient/persistent in its downtrend. Therefore, whether I am in profit or loss with ETH, I would place stop-limit orders to sell and buy in at a cheaper price.
To make an entry at cheaper prices, in this notes, I’m using Volume Profile indicator provided in tradingview.com (For more info, please ref: https://www.tradingview.com/wiki/Volume_Profile)
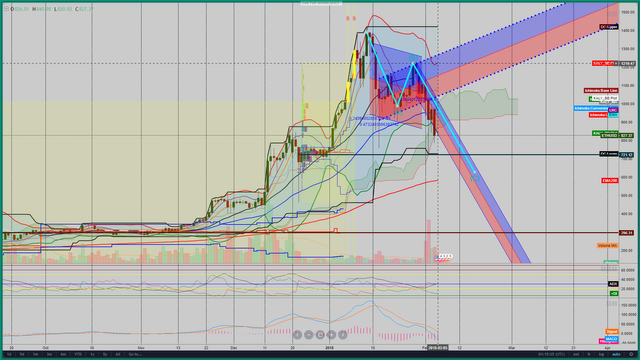
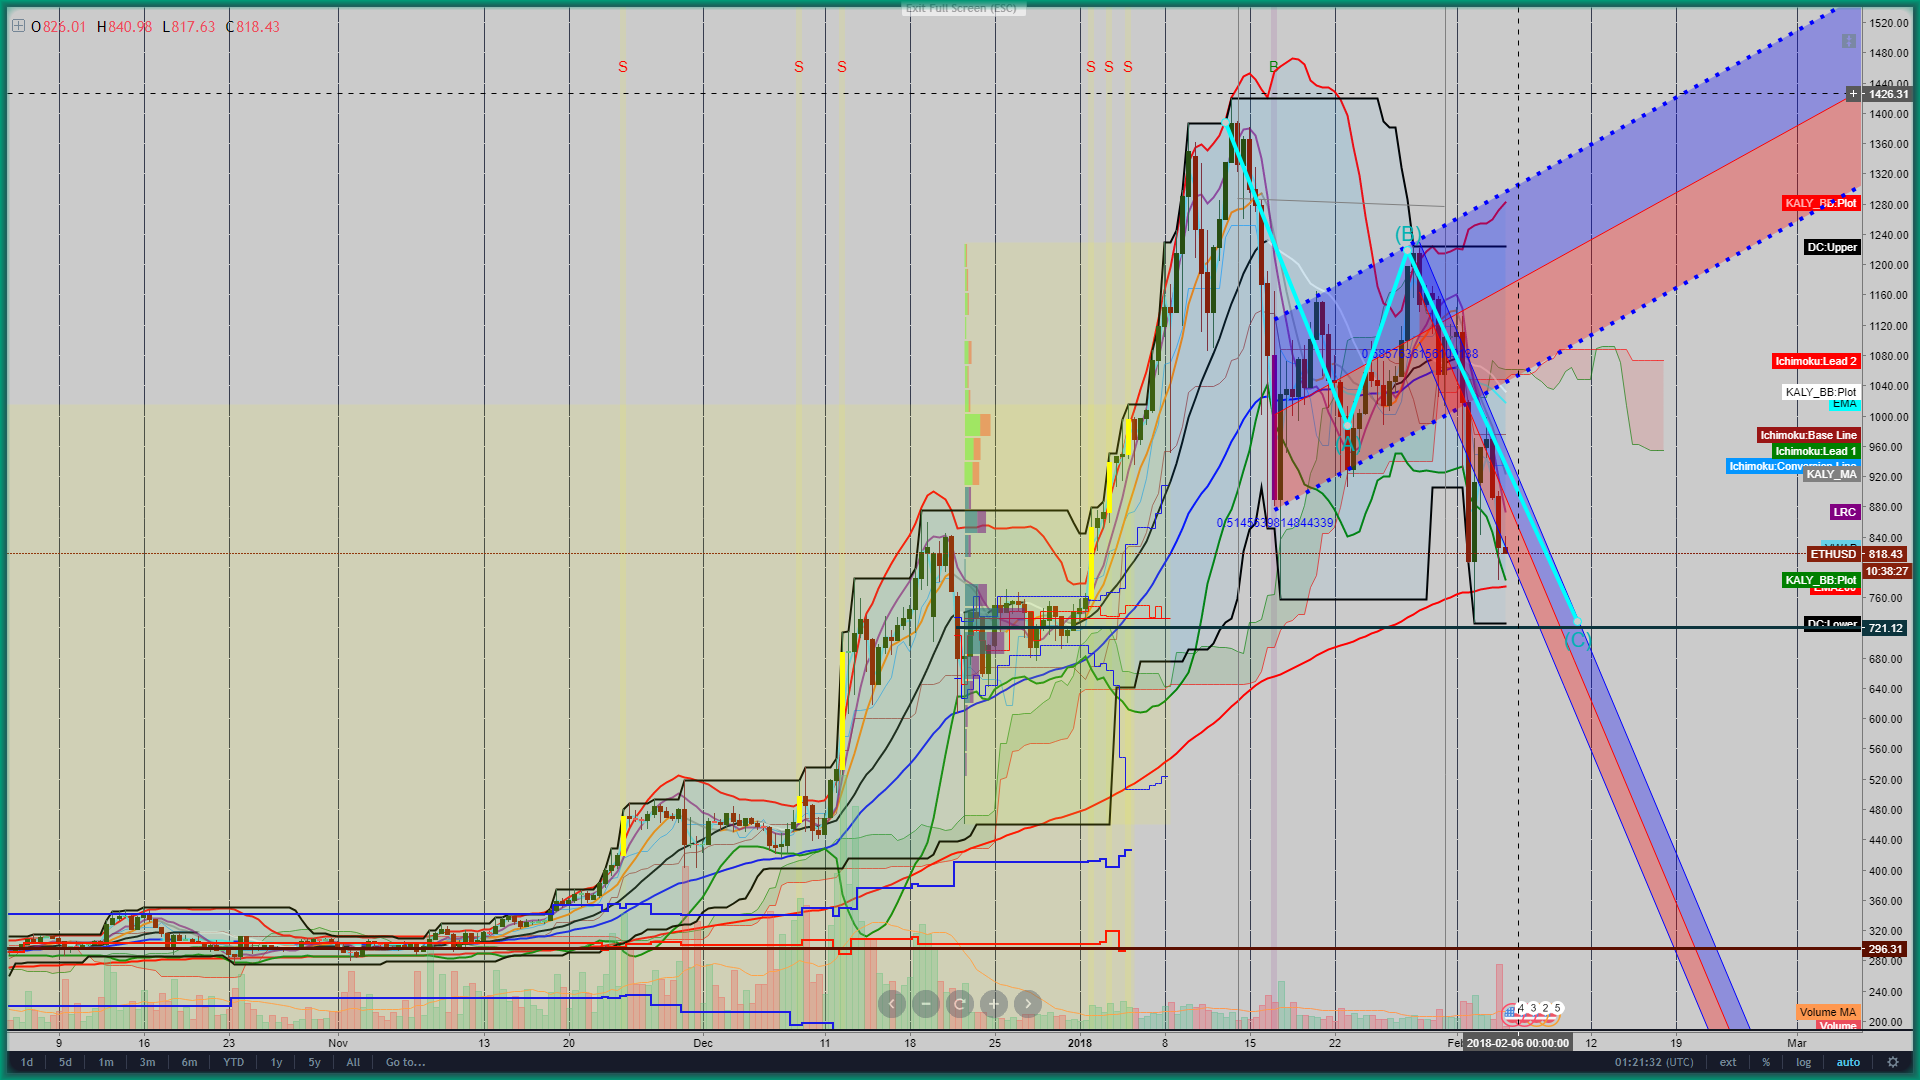
Screenshot of ETHUSD(Coinbase) daily chart:

From the above chart, it appears that if the daily candles drop down below Lead 2 of Ichimoku Cloud, then the candles could slide further down. I’d be waiting until Feb 05 2018 to know if the candles will indeed slide below Lead 2 of Ichimoku Cloud.
If they did drop down below the Ichimoku cloud, where is the next support? Obviously the next support is near the 200 day EMA(red string). Over a period of time, candles will meet 200day EMA between $600 to $700 USD. 200day EMA is around the average price one would be willing to pay for ETH in that particular year(In this case, it is 2018).
Screenshot of ETHUSD(Coinbase) 12 hour chart showing higher probability of price support:

The above 12 hour chart shows a higher probability of ETHUSD support price.The horizontal dark-green line is the Point of Control(POC). In the best case, ETHUSD may reach this POC before it stabilizes and/or reverses its trend. Its around 700 dollars….
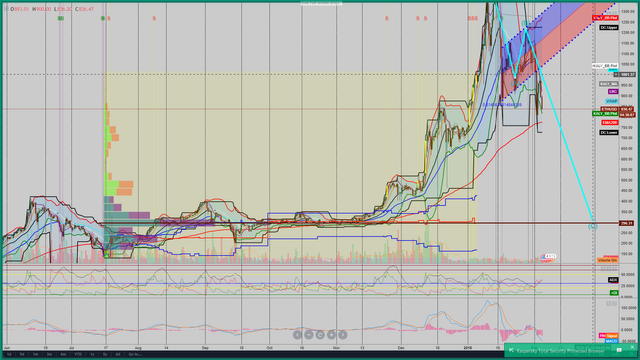
Screenshot of ETHUSD(Coinbase) 12 hour chart showing worst case condition:

The above 12 hour chart shows the worst case for ETHUSD. The dark brown line is the Point of Control(POC). In the worst case, ETHUSD may reach this POC before it stabilizes and/or reverses its trend. Its around 300 dollars….
Therefore, I think ETH is not a buy, may be a hold or a sell as of today(Feb 04 2018, Time: 20:42 UTC)!…Please let me know what you think!
More Details will follow as time permits. Please let me know if I am missing anything…..
Legal Disclaimer: I am not bribed to write here and I am not seeking insider favors. I wrote here so I get replies from fellow viewers to educate myself and for my daily expenses. Hence, if anyone uses this post for making their decisions, I am not responsible for any failures incurred.
Safe Trading!
Kal Gandikota
PS: If you found this blog post interesting and edifying please follow, upvote, resteem.
PS2: Please kindly donate for my daily expenses (atleast as you would on streets) at the following addresses:
ETH Wallet - 0x0450DCB7d4084c6cc6967584263cF6fBebA761D1
BTS Wallet - chip-maker
QTUM Wallet - QhqqV3WQV236Tz5ZbPceXXvU8aK2N4i78A
NEO Wallet - AUdiNJDW7boeUyYYNhX86p2T8eWwuELSGr

PS3: To open a cryptocurrency trading account at the brokerage where I trade most for now, please kindly use the following website(with referral code attached):
https://www.binance.com/?ref=18571297
PS4: Podone aims to provide employment to anyone anywhere around the world. Their concept is simple and can be implemented on time appreciating their market cap. I got 600 tokens of podone called QBE(Qubicle) for 0.2ETH. Please research this company and if you’d like to invest, please kindly use my referral link so you get a 5% bonus tokens on top of your purchase. (Feb 15 2018 last date)
PS4: Glossary of Terms Used
ETH Ethereum
ATH All Time High
EMA Exponential Moving Average
MACD Moving Average Convergence Divergence
OBV On Balance Volume
POC Point of Control
References:
https://www.tradingview.com/wiki/Volume_Profile