A little drop on Ethereum

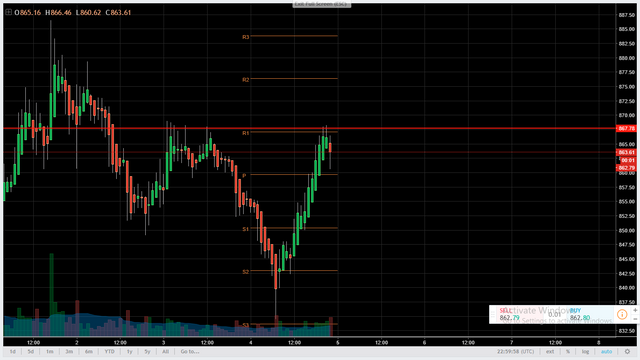
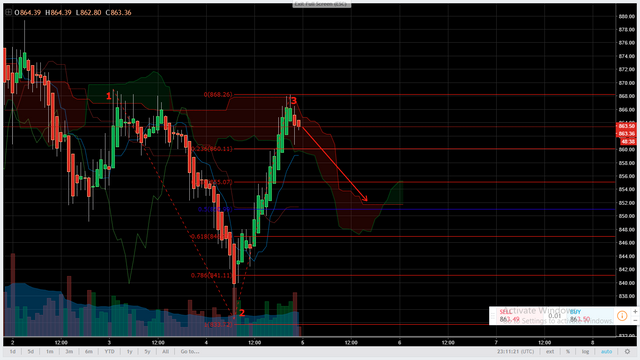
As you can see in the 1 H time frame chart the price is realizing a double ceiling that in turn coincides with the daily pivot point, which means a possible steep drop to the levels of $ 850 USD per unit, in the following image we observe marked the double roof with a straight red line.
As you can see, we have the daily pivot point which is being tested by the price, if we add other indicators that I usually use too much is the ichimoku cloud, below is an image with this trend indicator, basically This indicator is used as follows, if the price is located below the cloud it is considered a bearish trend.
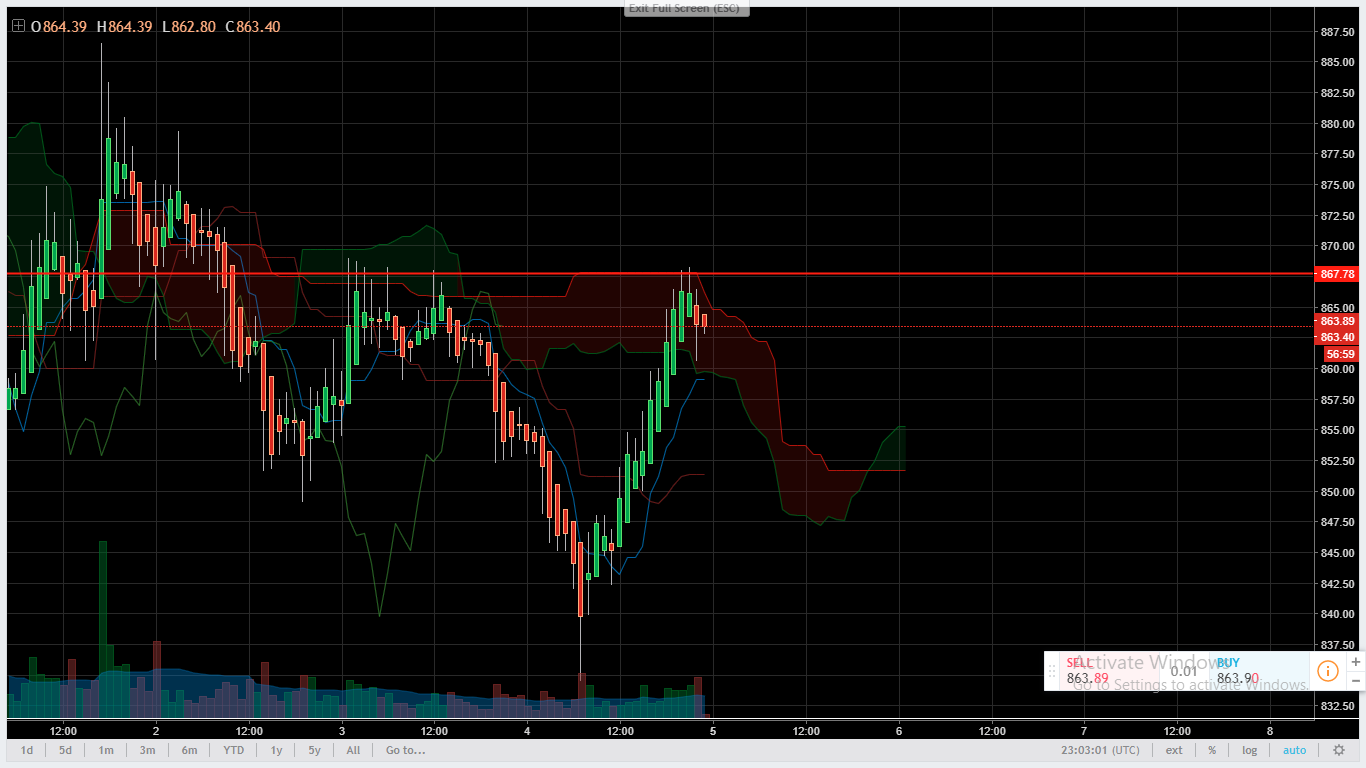
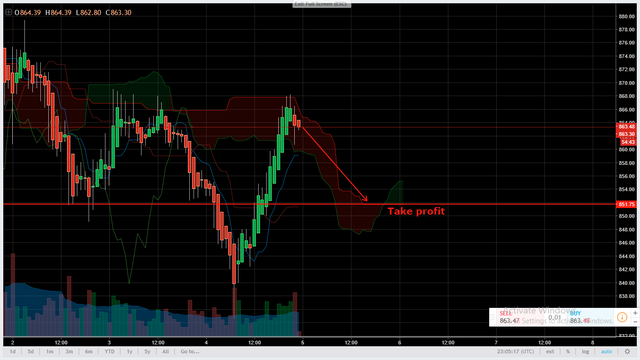
The price also collided with the cloud and it is possible that there will also be a drop in price, to define a possible exit in case we enter short and benefit from the fall that occurs we can leave in the cloud support that is indicated with the arrow.
To corroborate our exit with possible objectives in case the price continues to fall, we will use our tool trend-based fibonacci extension from which it is drawn from the highest level to the lowest of the levels with 3 clicks, the image is shown in a numbered way from where the tool was drawn.
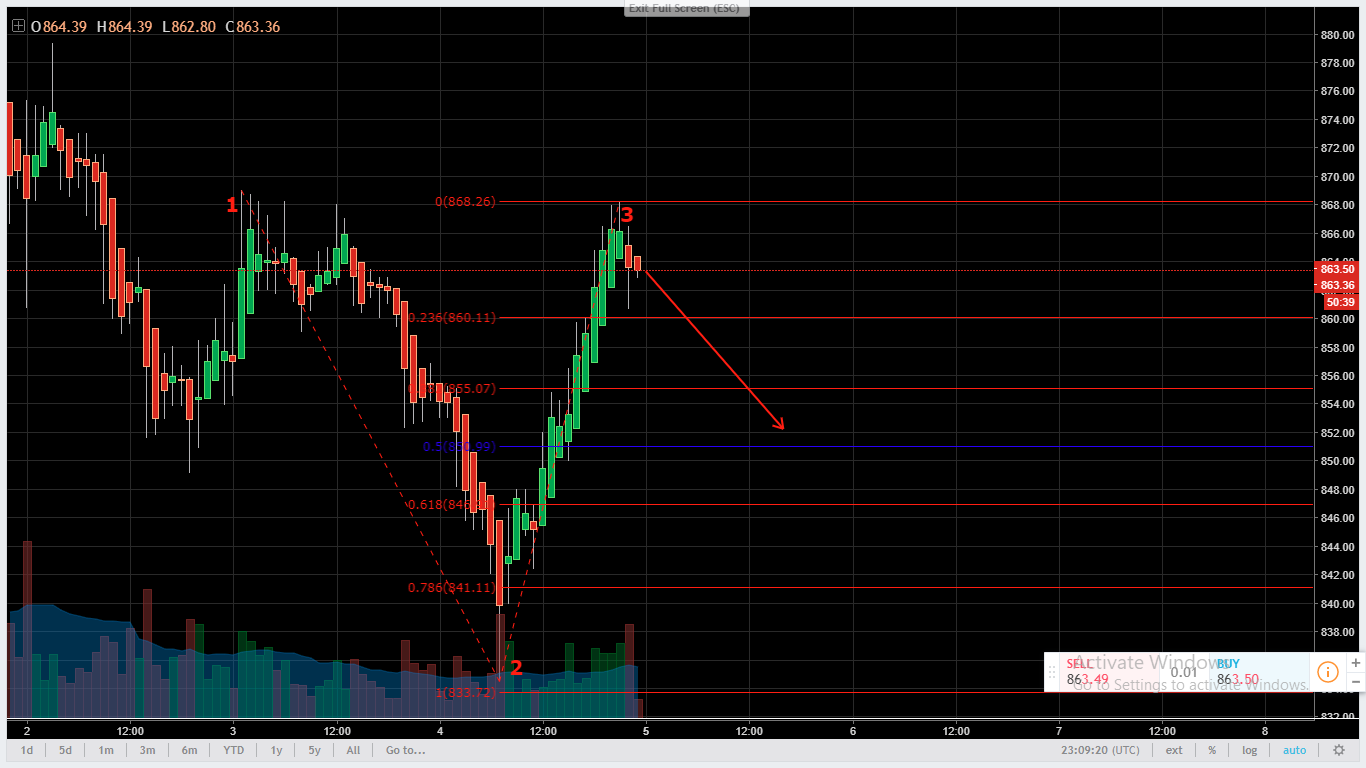
And as you can see the cloud coincides with the level of fibonacci retracement at 50% of the level, at this level it would be the possible objective of profit takings with our short entry.
Before entering make decisions on buying or selling it is advisable to perform your own analysis. You can get short in ethereum on Bitfinex exchange usin margin trading.