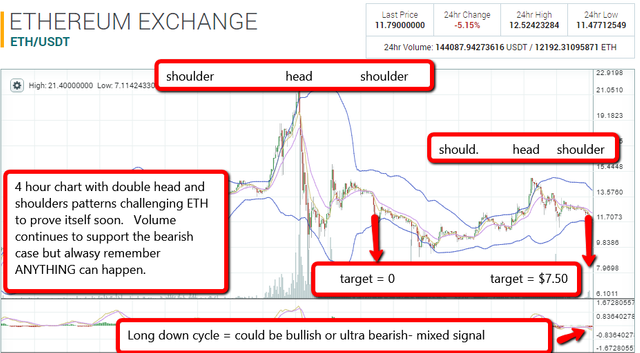
Ethereum amazing concept - but can't ignore this chart that has me avoiding $ETH / USD

for prior trades / posts see blog at https://cryptopatterns.wordpress.com/
for REAL TIME trades see Twitter https://twitter.com/Cryptopatterns
NOTE: NOTHING IN MY POSTS IS INTENDED TO BE TRADING ADVICE. Please do not base your trades on any information presented in the materials on this blog as it is for information and entertainment purposes only. You are 100% responsible for your own trading decisions.
Honest question:
is the head and shoulders considered valid, given that this chart also includes the unusual events of Hack, SF-fail, HF and ETC?
Personally, I tend to look more closely, after recent events, on a smaller scale. However, ETH/Fiat is so illiquid that I don't think it's really worth looking at those charts. But hey, that's just my opionion of course :)
Head and shoulder patterns are always valid - you just want to assess the probabilities of them playing out by considering other patterns and indicators. I keep a very open mind to these patterns actually PREDICTING all the events you listed above (hack, sf fail, etc) - trading stocks is all about information, and it seems logical to me that the buying and selling patterns on a chart would indicate investors who know more than we do making their moves. But when it comes to head and shoulders patterns I don't give them a ton of weight unless other factors confirm them because all traders know about them and all see them--but to ignore them is a very dangerous game. Hope that helps.
I dont really understand what you are trying to explain in your graph. Anything can happen with crypto currencies really.
You should have seen the shoulder when DAO started rocking and when the hacking happened, ETH dropping by 7-8$ in a night.
Anyways I like graphs ^^ upvote!
Hey @chend Thanks for the upvote! The graph shows a head and shoulders pattern which is very bearish meaning prices have a high probability of going down. (not probability not certainty). There is a method to determine the potential downside target on these patterns and those are shown on the chart. The bigger one actually calls for ETH to head to zero. The takeaway is if we get to $10 and below the probability of ETH going much lower increases a great deal. Hope that helps--any questions please ask--happy to claifry
Keep up the great work @lbtyf
Upvoted