ETHEREUM ANALYSIS | WEEKLY CHART | RISING WEDGE | POSSIBLE TARGETS |
Hey Guys !! i hope u all are having an amazing day
Today i will do analysis of ethereum on a "WEEKLY CHART"
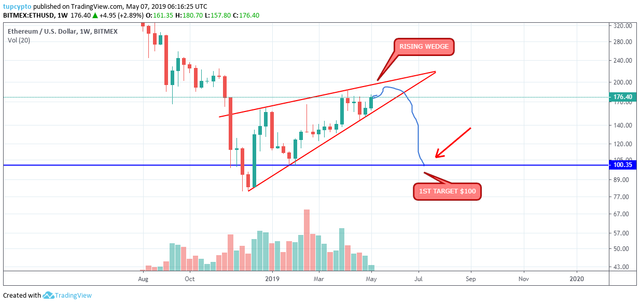
As you fuys can see the above image showing a proper rising wedge in Ethereum Bitmex weeklychart
we all know that the rising wedge gives breakout towards the downside on 90% of the times
Now all you need is to put ur focus on the below trend line and take a good short position with (stop loss) whenever it breaks the trend line with a good volume!!
the 1st target is mentioned in the image itself !
DISCLAIMER-
"ANALYSIS ON TUP.CRYPTO IS ONLY FOR KNOWLEDGE AND LEARNING PURPOSE, WE DON'T TAKE ANY RESPONSIBILITY OF YOUR LOSSES OR PROFITS IN ANY CASE !
FOLLOW RESTEEM & UPVOTE FOR DAILY ANALYSIS OF BITCOIN AND SOME ALT COINS !!
HAPPY TRADING !