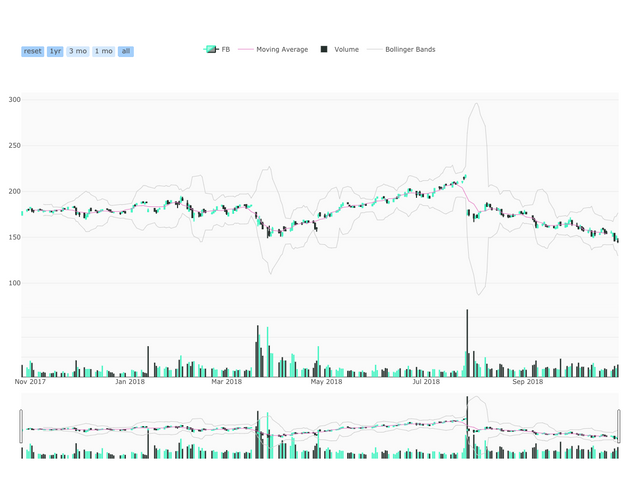
Facebook, Inc. (FB) Stock Analysis
Facebook, Inc.(FB)

Company Description
Facebook, Inc. provides various products to connect and share through mobile devices, personal computers, and other surfaces worldwide. Its products include Facebook Website and mobile application that enables people to connect, share, discover, and communicate with each other on mobile devices and personal computers; Instagram, a community for sharing visual stories through photos, videos, and direct messages; Messenger, a messaging application to communicate with other people, groups, and businesses across various platforms and devices; and WhatsApp, a mobile messaging application. The company also offers Oculus virtual reality technology and content platform, which allows people to enter an immersive and an interactive environment to train, learn, play games, consume content, and connect with others. As of December 31, 2017, it had approximately 1.40 billion daily active users. Facebook, Inc. was founded in 2004 and is headquartered in Menlo Park, California.
| Valuation Metrics | Facebook, Inc. |
|---|---|
| Price | $145.37 |
| Daily Range | -0.31% |
| Opening Price | $145.82 |
| Daily Price Range | $143.80 - 149.00 |
| Bid | 146.06 x 1800 |
| Ask | 146.39 x 800 |
| Fifty-Two Week Range | $143.80 - 218.62 |
| Trading Volume | 31,303,341 |
| Average Trading Volume | 25,551,153 |
| Market Capitalization | 419.715B |
| Beta | 0.70 |
| P/E Ratio (TTM) | 22.49 |
| EPS (TTM) | 6.46 |
| Earnings Date | Oct 30, 2018 |
| Forward Dividend & Yield | N/A (N/A) |
| Ex-Dividend Date | N/A |
| Target Price | $207.26 |
| Sharpe Ratio | -0.38 |
Summary Statement:
Facebook, Inc. currently trades at a spot price of $145.37 with a one-year expected target price of $207.26 meaning an expected forward return over the next year of 42.57%. Some important measures to look at is the company's beta of 0.70 the company's Sharpe ratio of -0.38.