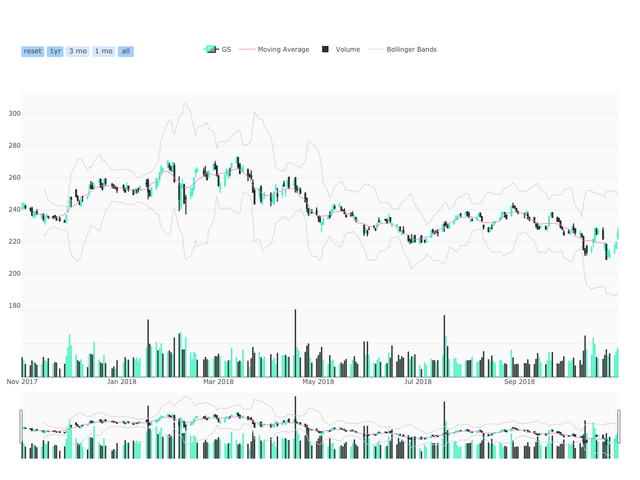
The Goldman Sachs Group, Inc. (GS) Stock Analysis
The Goldman Sachs Group, Inc.(GS)

Company Description
The Goldman Sachs Group, Inc. operates as an investment banking, securities, and investment management company worldwide. It operates through four segments: Investment Banking, Institutional Client Services, Investing & Lending, and Investment Management. The Investment Banking segment provides financial advisory services, including strategic advisory assignments related to mergers and acquisitions, divestitures, corporate defense activities, restructurings, spin-offs, and risk management; and underwriting services, such as debt and equity underwriting of public offerings and private placements of various securities and other financial instruments, as well as derivative transactions with public and private sector clients. The Institutional Client Services segment is involved in client execution activities related to making markets in cash and derivative instruments for interest rate products, credit products, mortgages, currencies, commodities, and equities; and provision of securities services comprising financing, securities lending, and other prime brokerage services, as well as markets in and clears client transactions on primary stock, options, and futures exchanges. The Investing & Lending segment invests in and originates longer-term loans to provide financing to clients; and makes investments in debt securities and loans, public and private equity securities, and infrastructure and real estate entities, as well as provides unsecured and secured loans to retail clients through its digital platforms. The Investment Management segment offers investment management products and services; and wealth advisory services consisting of portfolio management, financial planning and counseling, and brokerage and other transaction services. The company serves corporations, financial institutions, governments, and individuals. The Goldman Sachs Group, Inc. was founded in 1869 and is headquartered in New York, New York.
| Valuation Metrics | The Goldman Sachs Group, Inc. |
|---|---|
| Price | $225.37 |
| Daily Range | -0.17% |
| Opening Price | $225.76 |
| Daily Price Range | $225.48 - 228.88 |
| Bid | 226.98 x 900 |
| Ask | 227.06 x 1200 |
| Fifty-Two Week Range | $208.40 - 275.31 |
| Trading Volume | 1,341,552 |
| Average Trading Volume | 2,869,009 |
| Market Capitalization | 85.741B |
| Beta | 1.31 |
| P/E Ratio (TTM) | 16.57 |
| EPS (TTM) | 13.71 |
| Earnings Date | Jan 16, 2019 |
| Forward Dividend & Yield | 3.20 (1.49%) |
| Ex-Dividend Date | 2018-11-29 |
| Target Price | $275.22 |
| Sharpe Ratio | -0.59 |
Summary Statement:
The Goldman Sachs Group, Inc. currently trades at a spot price of $225.37 with a one-year expected target price of $275.22 meaning an expected forward return over the next year of 22.12%. Some important measures to look at are the company's beta of 1.31 the company's Sharpe ratio of -0.59.
Disclaimer: This article is not investment advice. As with any investment, investing in stocks is risky and can result in a loss including principal. For advice consult your licensed financial advisor or broker.
Data provided in this article was brought to you in part from Yahoo Finance, Robinhood (using Pandas data reader web API), and Quandl. If there is a stock that you would like to see analyzed and posted please comment below and tell me which company you would like to see. All company suggestions will get an up vote from me. Thanks for reading.
Hi! I am a robot. I just upvoted you! I found similar content that readers might be interested in:
https://www.bloomberg.com/research/stocks/private/snapshot.asp?privcapId=398625