Amidst the red candles. Good news for BTC... For now
Bitcoin has been shitting its pants for the whole of the month of May leading to a nasty drop in the fear and greed index. Yesterday we recorded the lowest number (8) in the fear and greed index. This could be the best time to buy Bitcoin. According to Warren Buffet "When there's greed in the market, that's when you panic and sell. But when there's fear, that's the time to get greedy"
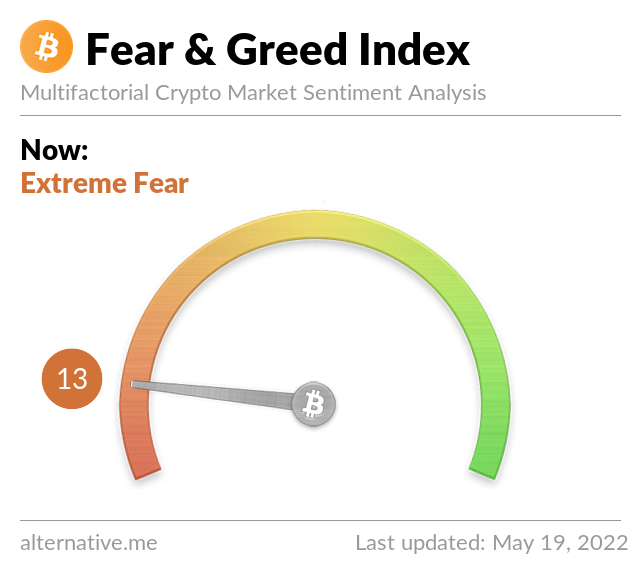
Currently there's extreme fear in the market. If you've been following my posts these past days, you must have seen me giving lots of bearish vibes. Yes the dip ain't over but I think we're at a nice price range where quick money can be made. Before we move on, there's a disclaimer I need to declaim. I am not a financial advisor nor do I have any intentions to be one. Everything you see here are just for educational purposes and for fun. If you want a financial advisor, you know where to get one. I can't tell you how to spend your own money. Without further ado, let's dive into the charts.
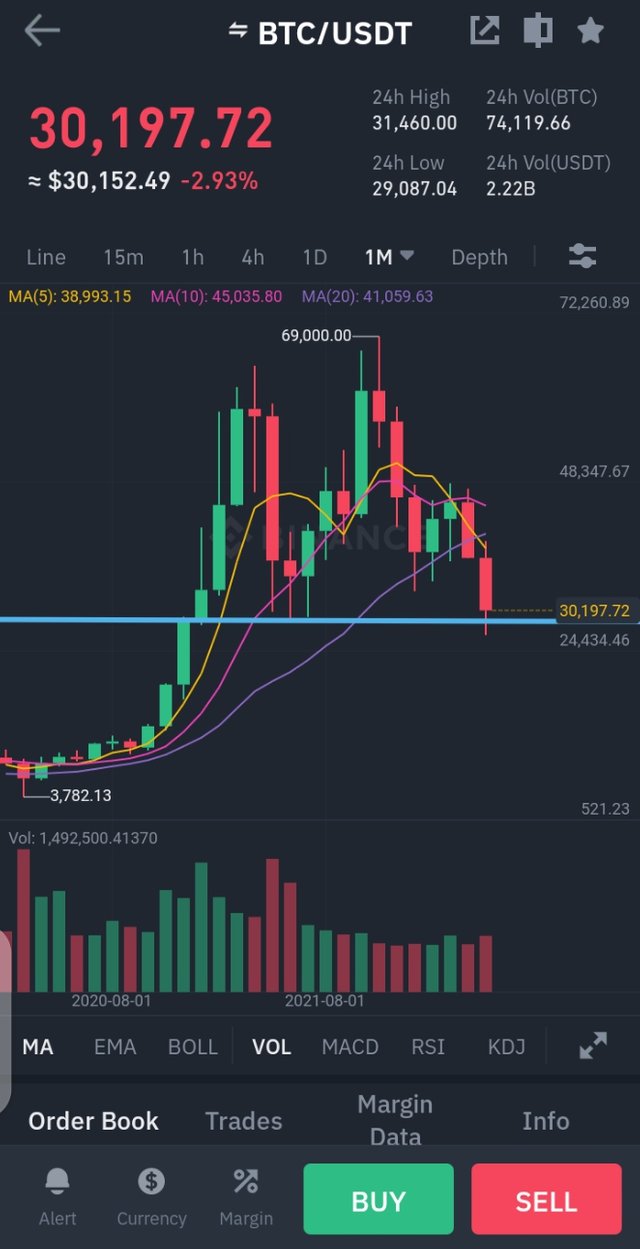
On the monthly chart we've seen support at around 29k despite wicking down to 26k, it was bought up immediately.
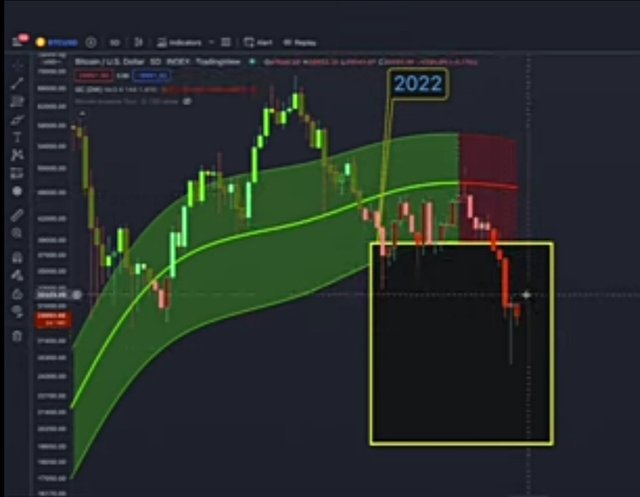
3day death cross
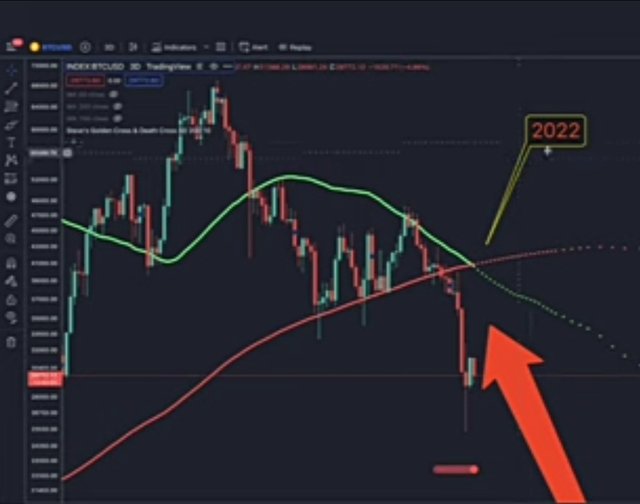
The long awaited 3Day death cross on BTC just happened 2days ago which confirms the bear market of 2022. For more details about that, check my post here
On the long term we might be seeing below $22k soon 🤑.
what is my short term price target?🤔
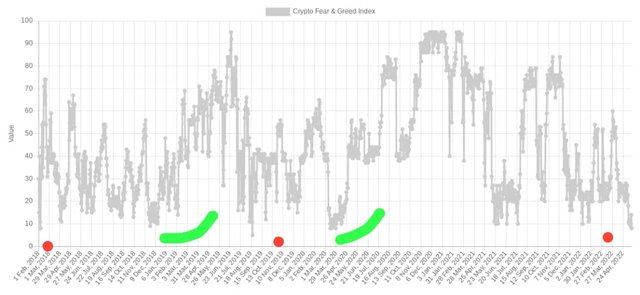
Looking at the fear and greed index on coin telegraph site. There are many information in the chart and I wouldn't wanna bore you with the details, I'll just explain what I saw and "think" might play out
The first orange dot on the left showed a low of 11 on 5th of February 2018, was that a perfect Time to buy BTC?
The next low(green) was 28th November 2018 and was about 14
The next low(orange) 21st of August 2019 gave an 11( extreme fear)
The next(green) 30th of March 2020(Covid crash) gave 12
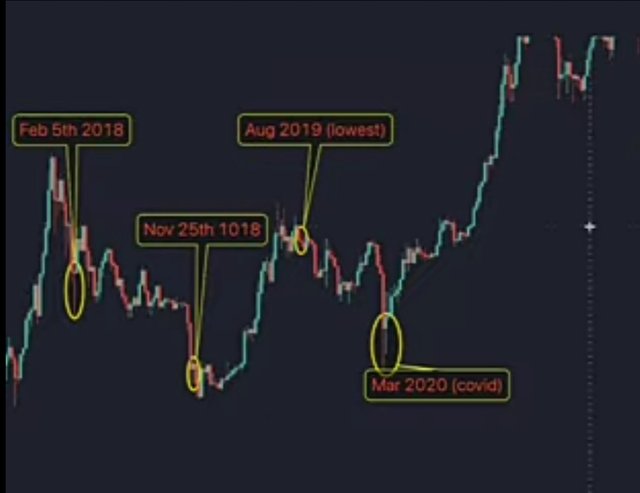
From the charts, every fear and greed index showed a good buy opportunity. The two green were the best times ever to buy BTC since 2018 because they indicated the lowest points of the market.
Today, the most important one is the first dip on the 5th of February 2018. After the dip, there was a 10-24% rally before the dump. This is quite similar to where we are today. We just had the death cross, were at support($29k) and we could rally back to our resistance at $40k or at least $36k
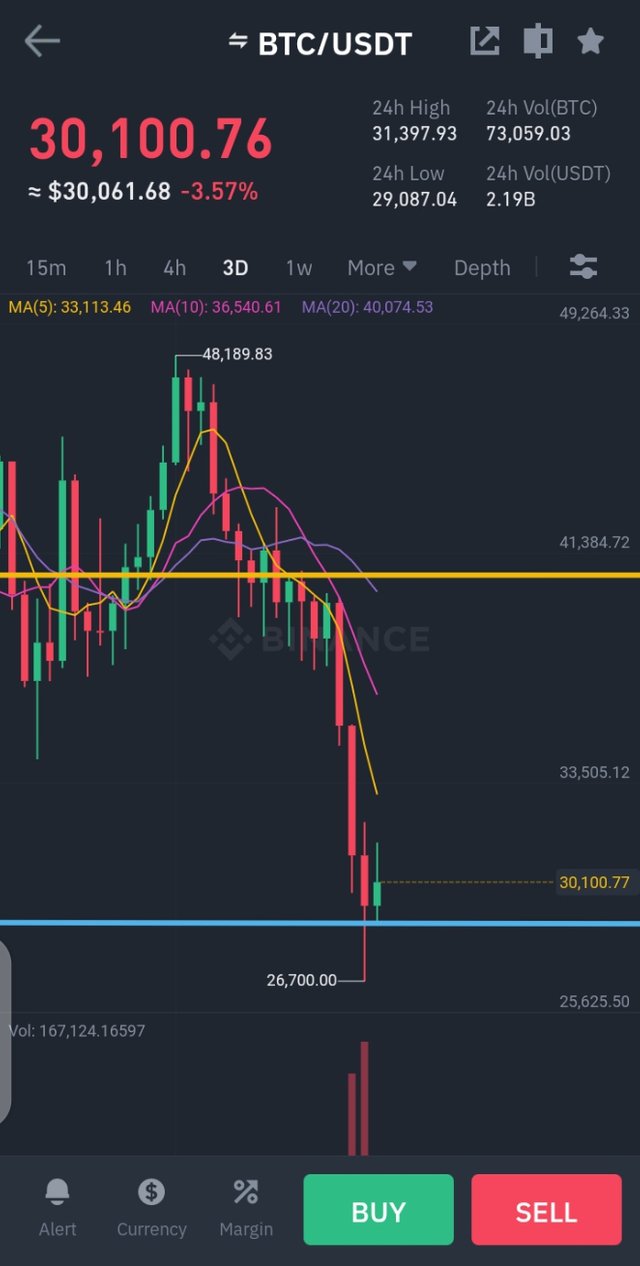
One thing to note on the fear and greed index chart is what indicates the bottom of the bear market. If we stay around this level for a long time(1-2months) then that's the bottom as shown in 28th November 2018 and the Covid crash in March 2020.
Also don't forget that we're in the golden zone, buying here won't matter in 2025 cus you'll look like a god 😎 regardless of if you bought at $29k, $32k or even $19k. DCA and stop looking at your wallet value until the next halving 😆
Do have a wonderful day ahead. I'll catch you on the next one ✌ 😎
