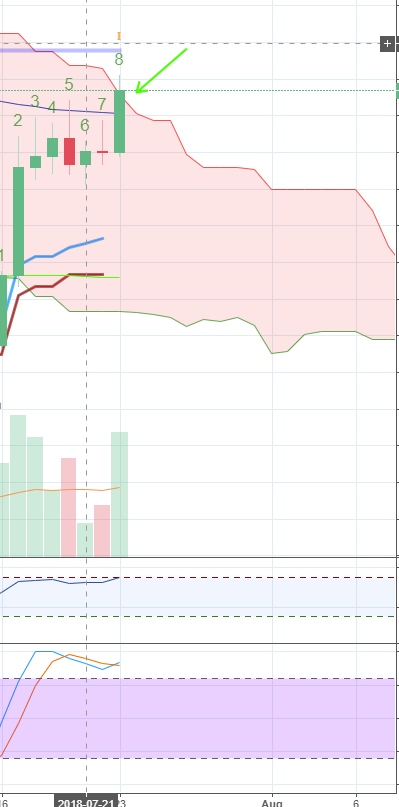
[BTC] Analysis on the Daily chart.
HI All, Crypto Sludge here.
You know that i like to write analysis about BTC when i see something special. So i think i do see something interesting.
This whole week the market had woken up, we saw some nice volume levesl and the price have gone up nicely. However all this action was on the lower time frames, the weekly and the daily charts have still remained bearish. Furthermore BTC had very hard time breaking 7500.
Since 7500 was broken, we are at an interesting point, and although i am getting conflicting signals from my two main indicators, it is still an interesting position, if not to trade but at least to adjust strategy.
If we look at the daily chart, if the price will hold in the 7600$-7700$ area, we will have a technical breakout from the ichimoku cloud. A momentum breakout. This will in fact \turn the daily chart bullish as well. The last time we saw above the daily cloud action, was back in May. From my experience bitcoin has reacted well to technical cloud breakouts, at least for a short while.
On the flip side, the StochRSI is in the oversold area, and if the price action continues, the next daily candle will be a TD9 Sell, which usually causes a short 1-4 candle correction and then trend continuation.
A confirmation of this move, should bring us above 8K$ which is a serious psychological price point, I will personally \hold out, and watch for the breakout, the TD9 should give us a clear trading zone for continued trend confirmation. I will update once i'll see it.

Trade ON!
Crypto Sludge.