Gold Market Update : Cautiously Bullish
I have been posting my Fibonacci Fan analysis of gold over the last few months/years. We have already closed above this last level of resistance on the weekly and monthly charts, but the daily price is still below this level of resistance. The first chart shows where price was last week.
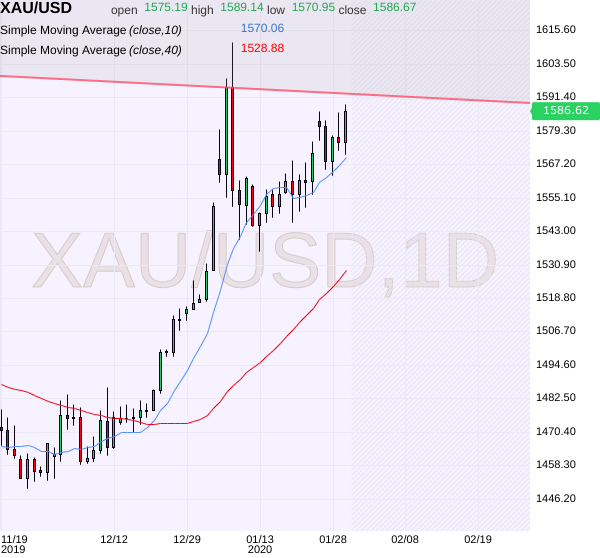
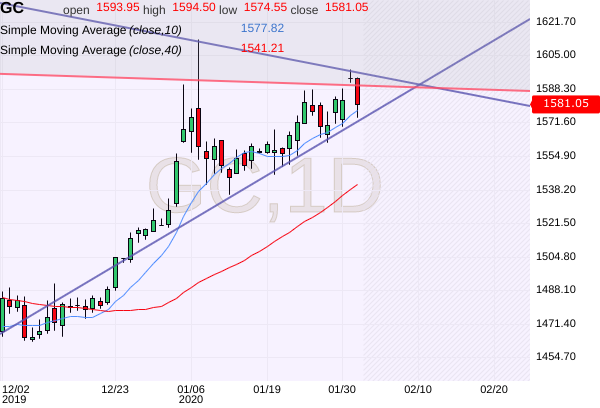
This second chart shows what happened to gold on open this week (on the daily chart). It's clear as day that this resistance is still proving to be a last line of defense. A close above the red line will be very bullish, and likely trigger the long awaited run to 1800. If, we are unable to break this level, we could see some considerable downside over the next few weeks/months.
I also added in the triangle formation forming (purple lines). Triangles, when broken, trigger big moves. This triangle will resolve this week. Be ready to go long or short based on the direction it breaks out.
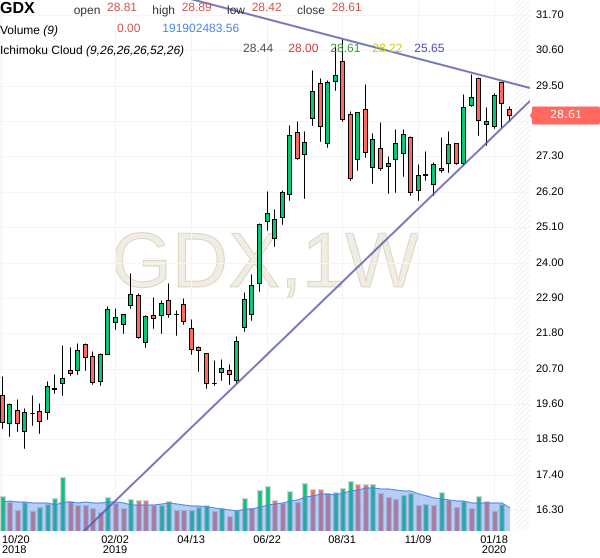
The last chart is the weekly view of GDX and the triangle formation forming on the daily/weekly charts. It seems the short-cartel have managed to manipulate silver and GDX to prevent the breakout. This has forced the majority of retail traders to close out their longs.
Even Gary Savage of SmartMoneyTracker.com has gotten out of gold mining stocks. He is generally correct in his calls, so I am cautiously bullish.
How to Play it
Go long. On a break above the triangle and a close above the red line, go leveraged long. Target price: 1800
Go short. On a break down out of the triangle, go short gold miners and SLV. Target price: Likely 1520. Possibly 1350.
Early entry: Tomorrow night, the Trump gives the SOTU. A drop of gold right into this 9pm EST can be expected. If you are looking to go long, buy before market close tomorrow (2.4.2020). As long as we do not close as a lower low on the weekly charts, gold is in a bull market for the intermediate term.
Goodluck. Have fun. Be safe.
-JT