2 CHARTS THAT SHOW GOLD SHOULD BE TRADING AT $2000 PLUS
By Edward Blake @ Renegadeinvestor.co.uk
Whilst there is a lot of noise around whether Gold has just transitioned into the next stage of its secular Bull Market, or whether the recent $1300 spot price is just a bounce before Gold heads down below $1000.
There are two charts that IMO can help provide clarity and remove the noise from the manipulation and shenanigans in the paper gold market.
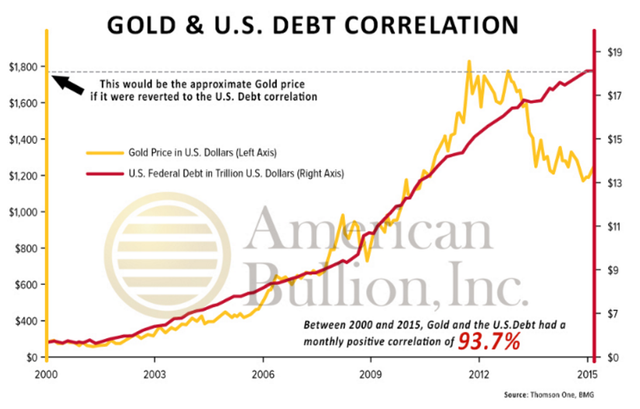
The first is Gold and U.S Debt correlation – As you can see from the chart below, in recent times. there was a very high 93.7% positive correlation between U,S Debt levels and the Gold price.
The fact that we are now seeing such huge divergence between the gold price and US debt levels indicates that Gold priced in U.S Dollars is likely trading well under its fair market value.

Even discounting all the other numerous fundamentals for owning gold right now; including global debasement of fiat currency, huge geopolitical risks, central bank lunacy and slowing global macro. Based purely on this chart if this correlation were to correct Gold should currently be trading North of $2000 oz.
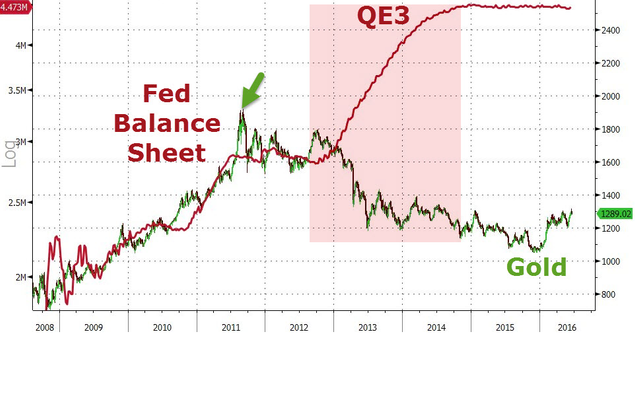
The second is previous Fed Balance sheet and Gold Price correlation –

Whilst the first and second charts are linked through QE to some degree, you can clearly see again that up until QE3 there was a very high positive correlation between the Fed balance sheet and the gold price.
However, since QE3 which has taken the fed balance sheet to a whopping $4.5tr and a balance sheet which has no chance of ever being unwound, without causing global financial turmoil.
You can see again that there is now huge divergence, which indicates that if the correlation was to normalise, Gold should be trading somewhere in the $2500 oz region.
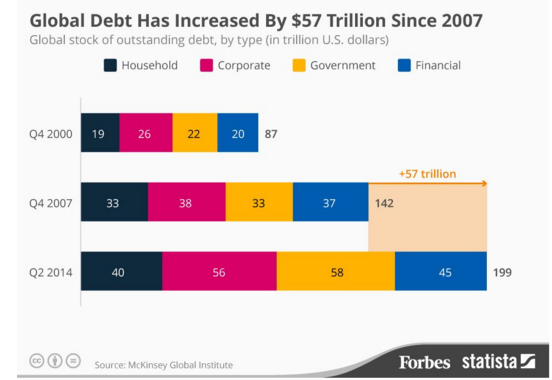
Whenever I hear a lot of noise around the paper price of Gold, I simply keep these charts in mind, because at some point precious metals are going to correct back to their fair market value and based on the trend of Global debt which has increased by $57 trillion since 2007; IMO its going to be somewhere well North of its current $1300 oz.

Hi! I am a content-detection robot. This post is to help manual curators; I have NOT flagged you.
Here is similar content:
http://www.renegadeinvestor.co.uk/uncategorized/2-previous-chart-correlations-that-show-gold-is-severely-undervalued/
@sharkybit great post about gold. I was not aware of the debt to gold link and wow do we have a divergence. Question is how long will it take to correct. Best play is probably to just sit long some gold since any other position that has a time cap on it is dangerous.
As the saying goes, "the market can stay irrational longer than one can stay solvent."
Yeah in order to avoid counterparty risk its best to go physical, but there is huge divergence like you say that indicates gold is severely undervalued in USD. Essentially, all precious metals do its track the increase in base currency which is what makes it such a good inflation hedge.
But i beleive manipulation either through naked shorts at the comex and or confirmed manipulation by Deutsche bank has caused the divergence.
http://www.bloomberg.com/news/articles/2016-04-13/deutsche-bank-settles-silver-price-fixing-claims-lawyers-say