Groundhog Day. Bitcoin Analysis (18-06-2018)

As expected, last week ended in favor of the bears. The weekly candle has a bearish body, which deprives any optimism of bulls.
Clearly seen the level of $ 5,900, which seeks price, it is here that the long-term support is located.
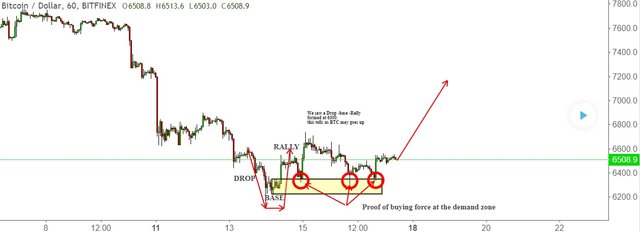
On the daily chart, you can see the breakdown of the global triangle down. Last week, the price reached a minimum around $ 6,100 and on Thursday a strong momentum rebounded up almost 10%.
The movement turned out to be really local, the momentum moved to flat, and then again a gradual decline began.
The breakdown of the triangle turned out to be classical: breakdown - going down - returning to the triangle boundary - re-descending.

For a long time, the movement of the main coin repeats essentially the same patterns, reminiscent of Groundhog Day: a fast upward impulse to which consumers are pouring in, then the chart takes the form of a plateau, the price moves in a narrow range, after which an even greater fall occurs.
The new week, most likely, nothing new to us will not bring. Important levels below: 6100-5900-5500-5200; at the top: 6700-7000-7100.