How to Conduct Simple Regression Analysis on Excel
Hi everyone,
As I am a finance major, I had to learn how to conduct a regression analysis on Excel during my undergraduate studies, and I would like to explain how you can perform this simple analysis on Excel in this article. ( I am assuming you already know what is regression analysis and its uses.)
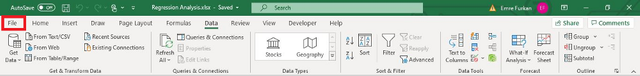
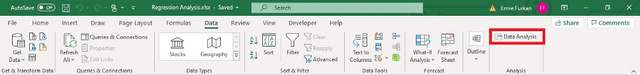
First of all, you will click on the ‘data’ option on your ribbon at the top of your page as shown below.

On the left side of the popped-up menu, you will see the ‘Data Analysis’ button. Do not worry if you didn’t because this means you didn’t activate the Data Analysis Toolpak which can be executed as follows:
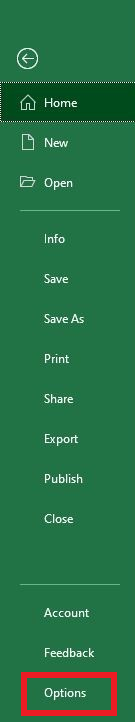
First, you click on ‘File’
And then, from the pop-up menu, you choose ‘Options’
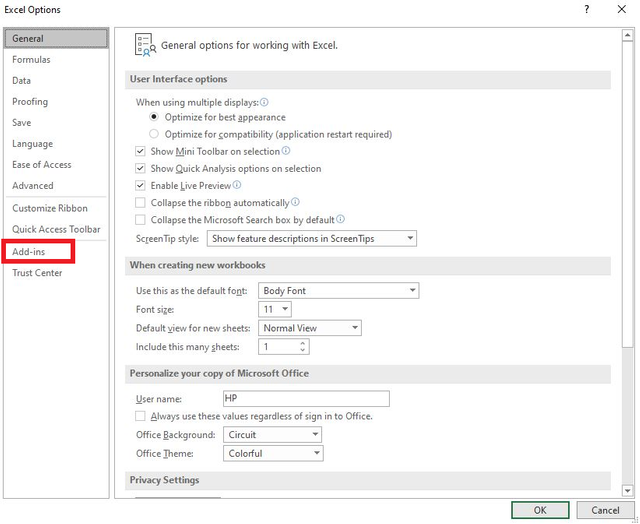
From the ‘Excel Options’ page that appears, click on ‘Add-ins’
Click on the ‘Go’ button
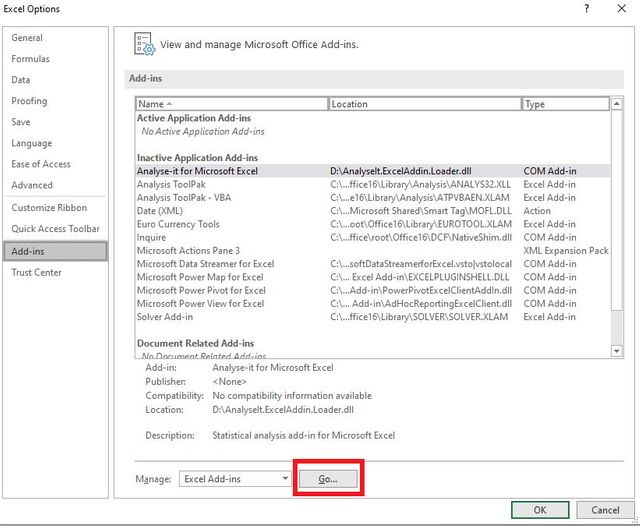
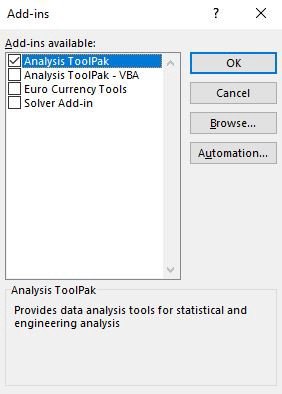
You are going to see the AnalysisToolPak Add-in, click on it, then click ‘OK’, and you are all set.
Now you will be able to see the ‘Data Analysis’ option when you click on the ‘Data’ on the ribbon.
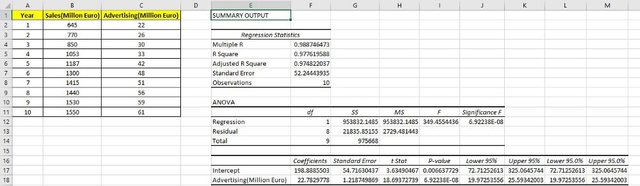
So, now we are ready to conduct a simple regression analysis. We have the following sample data which includes Sales for 10 years and Advertising spending corresponding to each of the 10 years.
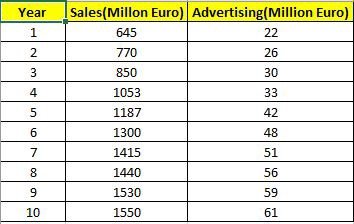
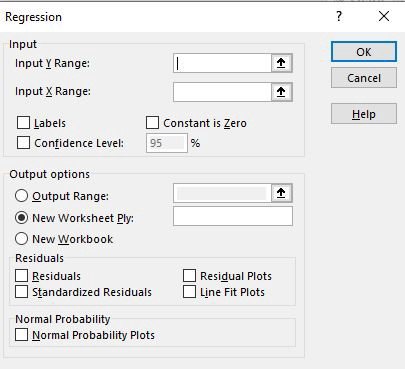
We want to see if Advertising spending has any effect on the volume of Sales. This is the reason why we will be conducting a regression analysis. Firstly, click on the ‘Data Analysis’, choose ‘Regression’ from the list and click ‘OK’. The regression page will appear where you will input your variables.
The dependent variable is denoted by 'Y' and the independent variable is denoted by 'X'. In our case, our dependent variable is 'Sales' and our independent variable is 'Advertising'.
How to input data:
1-Click on the 'Input Y Range' box, go to the data table, click on 'Sales' and scroll down to select the Y variables.
2-Click on the 'Input X Range' box, go to the data table, click on 'Advertising' and scroll down to select the X variables.
3-Tick the 'Labels' square.
4-Tick the 'Confidence Level' square.
5-From the 'Output options' you can choose where the results of regression analysis will be shown. It might either be a new worksheet or any specific cell on the same sheet.
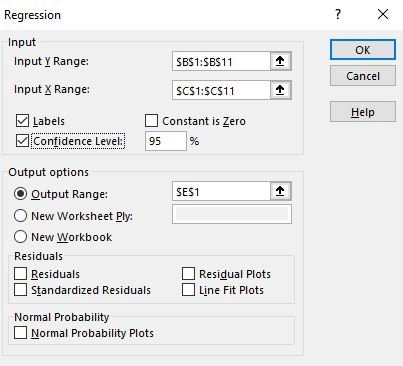
6-Click 'OK' and you are done!
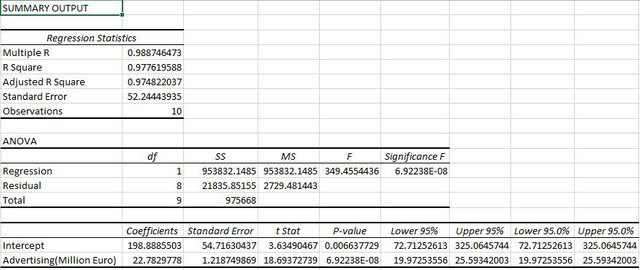
The following is the output you will get:
Final View:
Thanks for your interest. I hope it helped you to understand the basics of conducting regression analysis on Excel and follow me for more related content…