Take a look at the Gussian channel of the altcoin marketcap 🤔
on X(Formerly, Twitter)
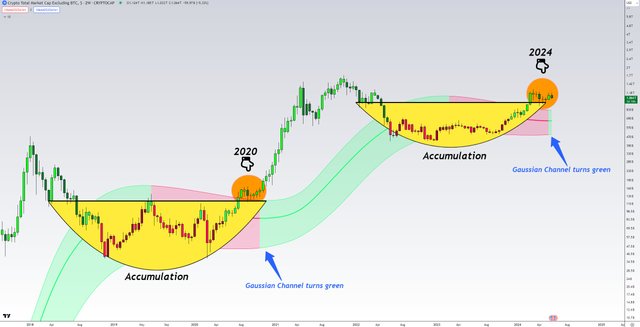
The Gussain channel is similar to the Bolinger band.
In the previous cycle, before the altcoin marketcap started skyrocketing, the altcoin marketcap had a correction, and it turned out the green area.
Now, the area color converted to green, and it seems that the current consolidation is over. As far as I remember in Nov and Dec 2020, the BTC price was attempting to break $20k ATH(All Time High), and the market sentiment of altcoins was in disbelief.
Every cycles, they said this cycle will be different. I agree somewhat. But, when you zoom out, it's not much different.
This comment is for rewarding my analysis activities. Upvotings will be proceeded by @h4lab and @upex
Upvoted! Thank you for supporting witness @jswit.
Congratulations, your post has been upvoted by @upex with a 100.00% upvote. We invite you to continue producing quality content and join our Discord community here. Keep up the good work! #upex
The Gussain channel is similar to the Bollinger band.
In the previous cycle, before the altcoin market cap started skyrocketing, the altcoin market cap had a correction, and it turned out into the green area.
Now, the area color has converted to green again, indicating that the current consolidation might be over. If I recall correctly, in November and December 2020, the BTC price was attempting to break the $20k ATH, and the market sentiment around altcoins was in disbelief.
In every cycle, people claim that this cycle will be different. While I agree to some extent, when you zoom out, the overall patterns are not much different.
Thank you for your insights.