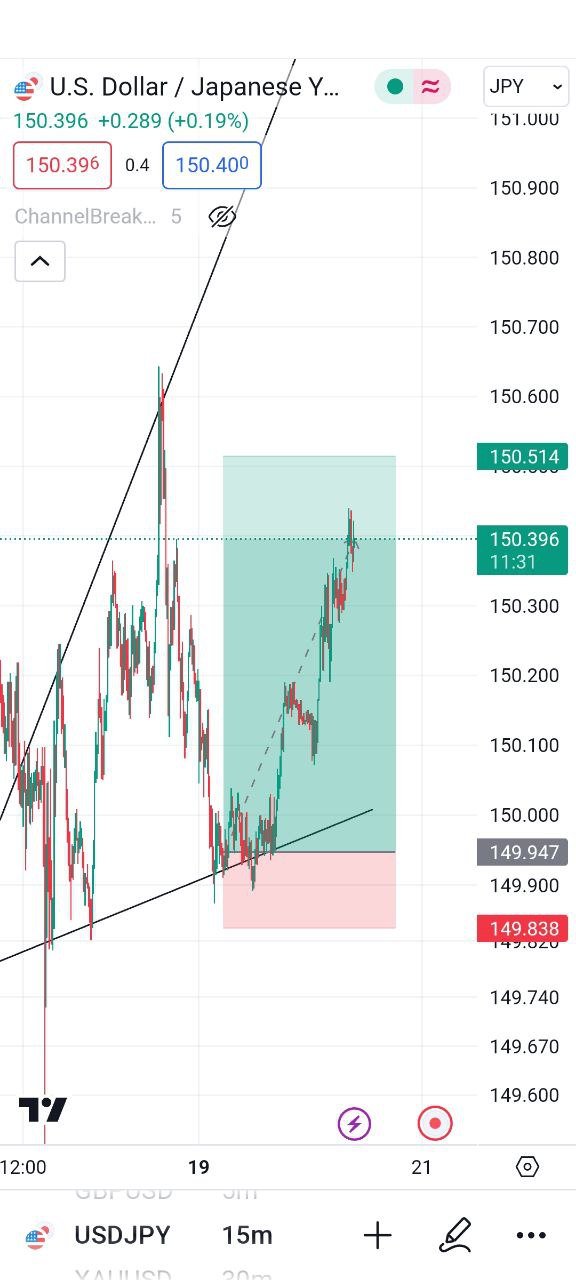
Candlestick charts for u.s.dollar to Japanese yen

The chart shows a 15-minute candlestick chart for the U.S. Dollar (USD) to Japanese Yen (JPY) currency pair on the FXCM platform. Here is a detailed breakdown:
Price Movements
• The chart captures price action over several hours/days.
• The price started at lower levels, around 155.300 to 155.400, then gradually rose.
• A sharp upward movement (breakout) is visible around the middle of the chart, indicating significant buying pressure.
• This was followed by a period of consolidation where the price hovered near 156.400.
• Toward the end, a strong rejection from the resistance zone occurred, leading to a sharp drop in price.
Key Resistance Zone
• The grey shaded area marks the resistance zone between 156.400 and 156.500.
• Price failed to sustain above this zone and faced selling pressure, leading to a reversal.
Candlestick Patterns
The chart shows a 15-minute candlestick chart for the U.S. Dollar (USD) to Japanese Yen (JPY) currency pair on the FXCM platform. Here is a detailed breakdown:
Current Price
• As of the latest data point, the price is at 156.276, showing a slight rebound after a sharp decline
Over all Summary
• Trend: Uptrend followed by a pullback.
• Resistance: 156.400–156.500.
• Outlook: A bearish move could continue if price fails to reclaim the resistance zone. Alternatively, breaking above it would signal a continuation of the uptrend.
@happycapital
@waterjoe