[Basic EMA Strategy + End of Trendline] | Crypto Academy / S4W6 | Homework post for @lenonmc21
Introduction
Hello to everyone,
In this post, there is the assignment of professor @lenonmc21 in this week's lecture. This Week's topic will be about EMA + Trenline breakout Strategy. The professor explained all the explanations on this subject beautifully in his lecture. Thank you to everyone who reads my post. Let's start!

Quesiton 1
Describe and explain in detail in your own words, what is EMA + Trendline Breakout Strategy?
EMA + Trendline Breakout Strategy, as the name suggests, is a strategy that is created by using the EMA indicator and the Trendline together. In order to fully understand this strategy, I will first briefly talk about EMA and Trendline issues.
Trend Line
I'm sure we all know about Trend Line. But for those who don't know, I still want to briefly mention it.
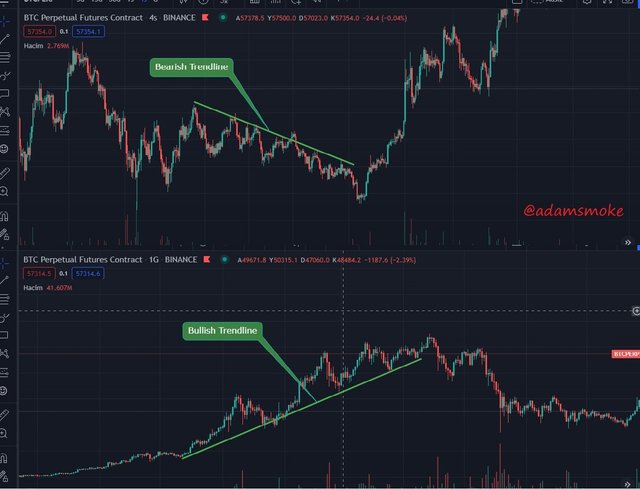
Trend Line: It is formed by combining at least two price points (from the high or low points) on the price chart of any asset. They are often drawn as support or resistance points. If the trend line extends downwards, it is called a downtrend. On the contrary, if it extends upwards, it is called an uptrend. We can see this more clearly with an image.
Exponential Moving Average (EMA)
The general purpose of moving averages is to determine the direction an asset's price takes relative to prices in the past period. It works with the same logic as there is a moving average in the EMA. However, one thing to be aware of is that moving averages are lagging indicators as they are based on past prices.
The way to use the EMA indicator is; it allows us to determine the direction of the market in general and allows us to see the trends clearly. They can also be used as decks and resistance levels. In the use of binary EMAs, they can also generate buy and sell signals.
Since we will use the EMA indicator to determine the trend direction due to our subject, I think this much information is sufficient.
Determining a trend with the EMA indicator is quite simple.
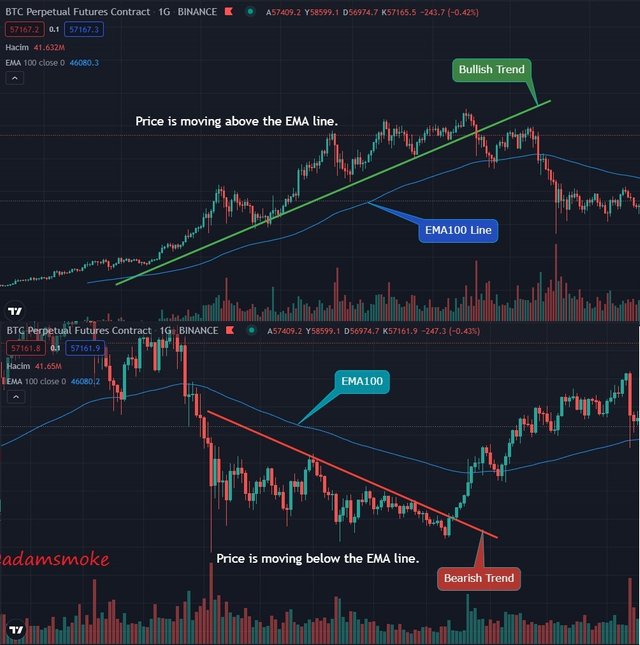
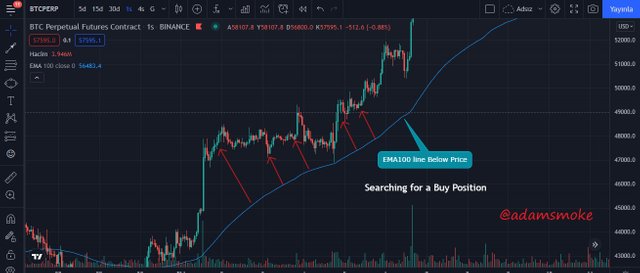
- If the EMA line is moving below the price, it tells us that the market is in an uptrend.
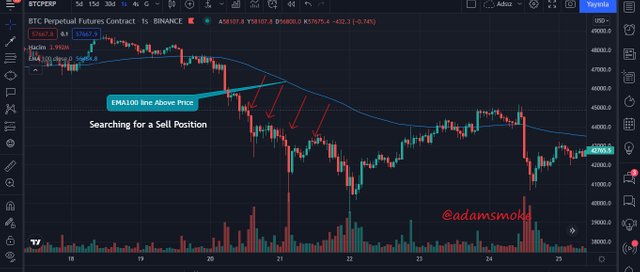
- If the EMA line moves above the price, it tells us that the market is in a downtrend.
We can see this more clearly on an image.
EMA + Breakout of the Trendline Strategy
We learned what the EMA indicator and Trend line are. Now when we combine these two, EMA + Breakout of the Trendline Strategy emerges.
We learned the use of the EMA indicator and realized that it is quite simple. In this strategy, we will use the EMA indicator to determine the direction of the trend on the market. As we said before, if the price is below the EMA line, it means that the market is falling, and if it is above the EMA line, the market is on the rise. Let's make sure we understand this concept correctly.
The trend line will be used a little differently in this strategy. If the main trend on the market is an uptrend, we will draw our trendline in the opposite direction of the uptrend. Likewise, if the main trend is a downtrend, we will draw our trendline in the opposite direction of the downtrend. Then we will wait for the price to clearly break the trend line we have drawn.
You may be a little confused, but we can clear this confusion with an image.
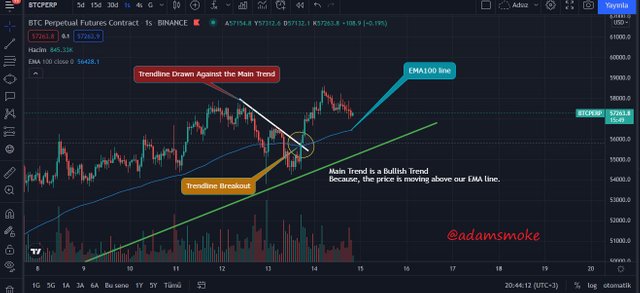
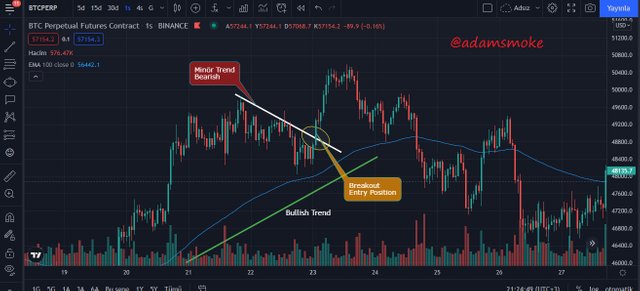
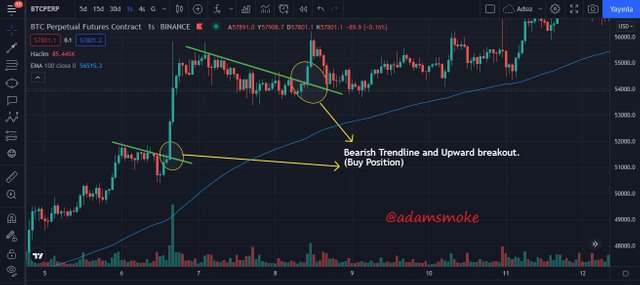
As we can see in the screenshot above;
- Price is moving above our EMA100 line and the main trend on the market is Bullish trend.
- Our Trend line, which we then draw in the opposite direction of the main trend, is a short downtrend.
- Our trend line, which we have drawn in the opposite direction of the main trend, is clearly broken as seen in the screenshot and the market continues to rise.
There are two points we should pay attention to at this point:
- After determining the direction of the trend with our EMA line, we should be careful to draw our trend line in the opposite direction of the main trend.
- Then we should look for our position as a buy as the market is also in an uptrend.
- Likewise, if there was a downtrend in the market; we would draw our trendline as an uptrend in the opposite direction of the main trend. We would call our position as a sales transaction.
Question 2
Explain in detail the role of the 100-period EMA in the EMA + Trendline Breakout Strategy.
EMA100 indicator; It is created by calculating the exponential moving average over a 100-day period. It is no different from other EMA uses. For this reason, its use in EMA + Trendline Breakout Strategy is not a use other than its normal use.
The main use of the EMA100 indicator in our strategy is to identify the Main trend. Because determining the main trend is very important in this strategy. In this strategy, we take our Position in the direction of the main trend.
- If the main trend is an uptrend, we call our position as a buy.
- If the main trend is a downtrend, we call our position as a sell action.
The EMA100 indicator is also useful in our strategy, apart from this basic use. As we mentioned before, we said that EMA indicators can also be used as support and resistance points.
If you pay attention to the images we show above; The point where the price breaks the trend line we have drawn in the opposite direction of the Main trend is also seen as the point where the price breaks the EMA100 line. When we remember the definition of the EMA indicator;
- It is used to determine the direction of the market. If it moves above the price, there is a downtrend, if it moves below the price, there is an uptrend.
- Can also be used as support and resistance points.
Now, let's examine our image above, remembering this definition.
As we saw above; The price is crossing both the trend line in the opposite direction of the main trend and our EMA100 line from the bottom up. So our EMA100 indicator tells us three things in this strategy.
- To determine the direction of the main trend,
- To see support or resistance levels clearly,
- To determine the time of the position we will take.
Note: Price may not break both Trendline and EMA line in every position. I just wanted to explain the signals given by the EMA line in the image above. However, profit rates may be higher in positions with such double breakdowns.
Question 3
EMA + Breakout Strategy Trendline Explain in detail the role of "Trendline" in Breakout.
In this strategy, both our EMA line and our Trend line are very important. Because, thanks to our EMA line, we can easily determine the direction of the market and then draw our trend line accordingly. The trend line is actually our key point in this strategy.
After drawing the trend line, it becomes our support or resistance line depending on the direction of the market. Then, we take our position when the price breaks this support and resistance line. So, at this point, our trend line tells us when to enter the position.
After drawing our trend line, we take our position as soon as we see that the price has clearly broken our trend line. Therefore, it is very important that we draw the trend line correctly. Let's explain with a visual again:
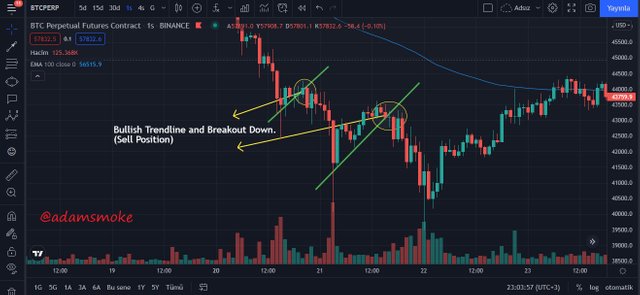
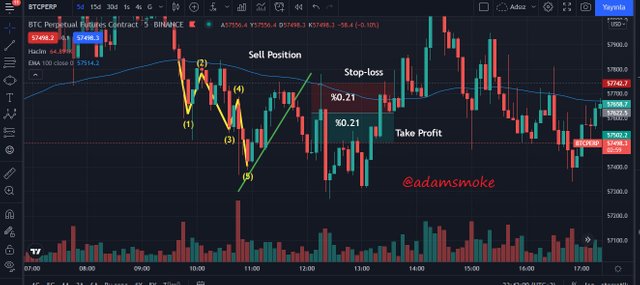
As seen in the screenshot above, we are waiting for a clear break of the main trendline to take our position.
Quesiton 4
Explain step by step what needs to be considered in order to properly execute the EMA + Trendline Breakout strategy?
In this section, I will explain the whole strategy step by step.
- The first thing we need to do is add the EMA100 indicator to our chart.
- Then we identify the main trend on the market using the EMA100 indicator.
- If the price is moving above our EMA100 indicator, the market is in an uptrend and we will call our position “Buy”.
- If the price is moving below our EMA100 indicator, the market is in a downtrend and we will call our position “Sell”.
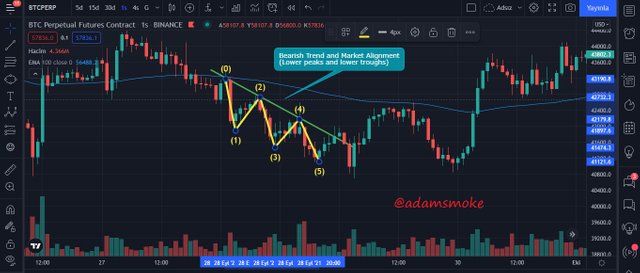
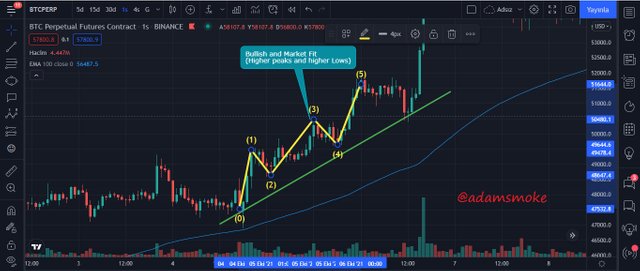
After determining the trend with the EMA100 indicator, we should be able to see the structure of the market more clearly. For this, we need to know the working principle of the loops, as we have done in the previous deck. If the market is in an uptrend; The “Peak and Low” points must progress by making higher “Peaks and Bottoms” continuously. Likewise, if the price is in a downtrend; The “Hill and Low” points should progress by making lower “Hill and Bottom” continuously.
After seeing the price congruence by examining the main trend and then the market structure, what we need to do is; will be to draw our trend lines so that they are in the opposite direction of the main trend. If the market is up, we will draw a downtrend, and if the market is down, we will draw an uptrend. Then we will wait for our trend line to break.
The trend line we drew in the opposite direction of the main trend:
- If it is a downtrend, the position we should look for will be a “Buy” position.
- If it is an uptrend, the position we should look for will be a “Sell” position.
Quesiton 5
What are the trade entry and exit criteria for the EMA + Trend Line Break strategy?
Entry and Exit Criteria
- The first thing we need to do is to determine the trend on the market. We will provide this with our EMA100 indicator. As we mentioned before; If the EMA100 indicator moves below the price, the market is on the rise, if the EMA 100 indicator moves above the price, the market is on the rise.
- Later, after determining the direction of the market, we will look at the fit of the market. Adaptability of the market; It means that the price makes higher peaks and troughs when in an uptrend, and lower peaks and troughs of the price when in a downtrend.
- Then we should draw a trend line opposite to the main trend on the market and wait for the price to break this trend line. After the breakdown happens, we need to make sure that the breakdown is correct. Once the breakout occurs and is certain, this gives us a buy or sell signal.
Our strategy will not work correctly if the above setup does not happen or if it is an incorrect setup (the market moves sideways or price alignment is not achieved). Therefore, we should wait until a correct installation occurs.
- Then when our installation is installed correctly; If the clear break of the trend line is realized, we take our position.
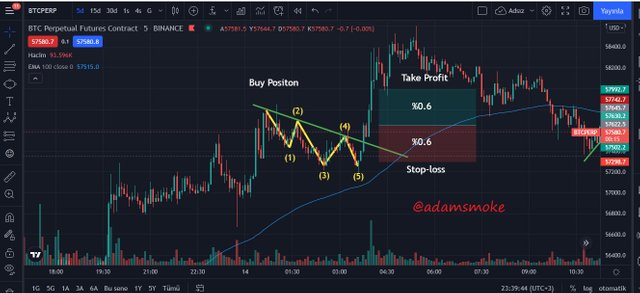
- After the breakdown, according to the direction of the market; We determine the last maximum or minimum note of the price as our “Stop-loss” point.
- Then we set a “Take Profit” level with our Risk:Reward ratio not less than 1:1. In this strategy, the R:R ratio is generally used at the 1:1 level.
Exercise
Make 2 entries (A Bull and a Bearish) on any "Cryptocurrency" pair using "EMA Strategy + End of Trendline" (Use a Demo account to make your entry in real time in any timeframe, preferably low temporalities)
I will show my trades through my Demo Account on Tradingview platform.
Buy Position (FTT/USD Pair)
After analyzing the market for a while, I saw a setup in the FTT/USD pair.
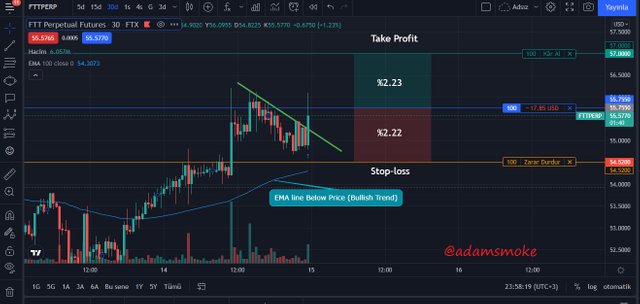
- Firstly, I set the Trend as Bullish Trend since the price is moving above the EMA100 line.
- Then I saw the price congruence and drew a Trend line.
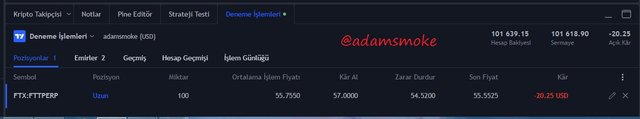
- There was a breakdown while doing the homework and therefore I was a little late to enter the position, but since there was a clear breakdown, I took my position as Buy at the level of 55,7550 USD.
- Then I set a point (USD 54.5200) slightly below the lowest point before the breakout as my stop-loss point.
- Then I set my “Take Profit” level with R:R ratio not less than 1:1 (57 USD)
The price was falling a little while I was writing this article and my position does not seem profitable at the moment, but I believe the price will increase.
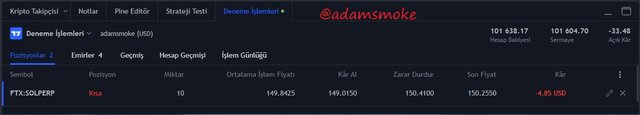
Sell Position (SOL/USD Pair)
After analyzing the market for a while, I saw a setup in the Sol/USD pair.
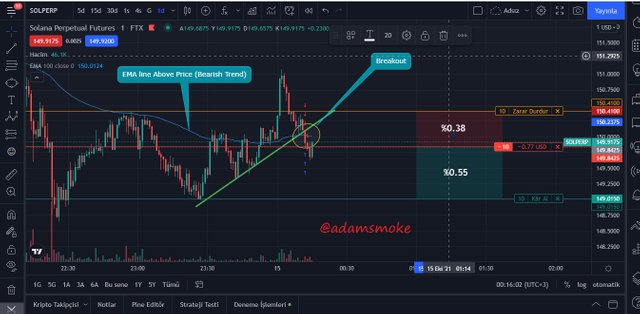
- Firstly, I set the Trend as Bearish Trend as the price is moving below the EMA100 line.
- Then I saw the price congruence and drew a Trend line.
- There was a breakout while I was doing my homework and therefore I was a little late to enter the position, but since there was a clear breakout, I took my position as Sell at 149.8425 USD.
- Then I set a point (USD 150.4100) slightly above the lowest point before the breakout as my stop-loss point.
- Then I set my “Take Profit” level with R:R ratio not less than 1:1 (USD 149.0150).
The price was a little higher while I was writing this article and my position does not seem profitable for now, but I believe the price will decrease.
Conclusion
In this lesson and in my post, we talked about a strategy of using EMA indicators that traders often use. EMA+ Trenline Breakout Strategy is an easy to learn and use strategy. I think that I have provided you with all the necessary information in my sharing so that you cannot use this strategy. I hope you are satisfied and like it.
I would like to thank professor @lenonmc21 for this nice and educational lesson and everyone who read my post. See you in the next lesson.
CC: @lenonmc21
