Mastering the Bull Run with Trailing Stop and Multi-Timeframe Analysis
Designed With Canva.
It is always a joy for me whenever I have the opportunity to participate in the Steemit contest weekly and today I will be participating in the crypto academy community contest. Stay tune below.
Question 1: Explain Trailing Stop and Its Usefulness in a Bull Run
As the world of trading and investing keeps evolving year by year. We continue to have more tools that helps in our trading journey and one of it which I will like to talk about is the Trailing Stops. When we talk about Trailing Stops, it is a useful tool that helps traders to be able to lock their profits even as the trader is still trading. What do I mean by that , with Trailing stops, it helps to adjust that particular asset price most especially when the price is moving in the uptrend direction.
How a Trailing Stop Works
Talking about how a Trailing Stop works, Trailing stop works by following the Price of a particular asset by helping to make sure that the price moves in the direction of that trader or investor. What do I mean by that? Take for example the price of that asset moves high, then the stop level move with it and if the price falls which in essence falls, the stop level then adjust. This helps trader to be able to identify the uptrend and still be able to manage their risk as it were when trading.
Let me use a clear illustration to back my explanation up. Take for example, I as a trader bought Bitcoin at $80,000, if I set take for example a 10 trailing stop, that means the stop order will be around $72,000. Now take for example if Bitcoin moves in the uptrend direction to $100,000, the trailing stop I set will also adjust and move upward to be set 10% below $100,000. So let's say Bitcoin started to move downtrend from that $100,000 to $90,000, the trailing stop I set will trigger a sell order around $90,000. By doing so, it helps me to lock my profit even if Bitcoin later decreases in price value.
Why Trailing Stops Is Useful During Bull Run
Talking about why trailing stops is always useful during Bull Run, as many of us know, during the bull run, the price value of assets keeps going up in a very strong upward momentum. Trailing stops are useful during those upward momentum because it helps traders or investors to be able to still remain in the profit position as far as the price keeps rising.
Not only that, it helps to protect the profit of the traders even if at any point the assets start moving in the downtrend direction. Trailing stop is also useful during the volatile market because it helps traders to make little profit from a short term uptrend and without the need of constantly watching the markets. It helps in profit taking and helps to protect price gains.
Types of Trailing Stops
Talking about the types of trailing stops, there are several types of trailing stops but because of this lecture, I will be picking the three listed in this lecture which I will be explaining below.;
- Percentage-Based Trailing Stops: The Percentage based trailing stops works in a way whereby it helps to keep a particular percentage distance from the peak price of the asset. What do I mean by that? If you see a 10% trailing stop on bitcoin at $80,000, that means the stop level is around $72,000. Take for example, Bitcoin now rise to $88,000, then the stop level will adjust to be at $80,000. If BTC now drops below $80,000, then the stop order is being triggered and helping to protect the profit.
- Fixed-Level Trailing Stops: When it is Fixed Level Trailing stops, it makes use of something called the point values instead of the percentages. What do I mean by that, I can chose to set a $10,000 trailing stop on Bitcoin that I bought at $80,000. If Bitcoin moves upwards to something like $100,000, then my trailing stop will adjust to something like $90,000. So if Bitcoin drops from that $100,000 to something like $90,000, then then the stop order is to trigger securing my profit at $90,000.
- ATR-Based Trailing Stops: The last one I will like to talk about is the ATR based trailing stops because it makes use of ATR to help point out the trailing distance. With ATR, it helps to point out the price movements of that asset averagely over a specific period. This is used to determine the level of Volatility of the asset. Take for example, if the ATR for bitcoin is $20,000, that means I might chose to set my trailing stop to be mupltiled by 2 ATR. ATR based trailing stop helps to find price fluctuations for the asset.
How Trailing Stops Protect Profits While Capturing the Upward Trend
Trailing stops which is naturally designed to help achieved profit protection and helping to increase the potential gain during bull market, then the trailing stops helps to adjust as the price movements keeps going upwards also. So as far as the asset price keeps moving up, the stop level keeps adjusting by itself and that it helps to lock profits. This works in a way whereby even if the asset now reverse, you will still earn profits at that level. This is very important during bull market because of the high Volatility that happens during the bull run.
Question 2: Multi-Timeframe Analysis for Steem's Bull Run
Multi-timeframe analysis is a very useful method of trading for actually making use of different timeframe to help understand in details how the market is performing most especially the trend of the asset that is been analyze. I will be making the Multi-Timeframe Analysis for Steem/USDT using different timeframe as you can see below;
1. Weekly Timeframe: Identifying the Macro Trend
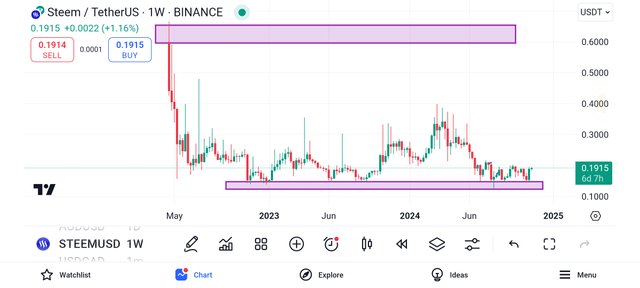
One of the things I have come to understand is that the weekly chart helps to understand the macro trend. What do I mean by that? If you will see from the image above, this shows a downtrend movement which is macro trend. From the macro trend analysis, I will say Steem is bullish and I mean a very long-term bullish trend.
- Refining Entry Points: Talking about the weekly timeframe helping for the entry point, if I will wish to enter the Steem market as a trader, I will be looking for a buy entry because from the chart above, it is bullish. But if I want to enter a buy entry, it will be on the shorter timeframe.
- Stop Levels: If I will want to set a stop loss levels based on the weekly timeframe analysis above, I will definitely make use of the support and resistance level drawn.
- Profit-Taking: Then finally talking about the Profit taking, I will say the weekly timeframe will help me to set realistic profit targets and that is because I was able to notice major resistance levels. Even though if you want to pick your profits using the weekly timeframe, then you must be a swing or positional trader which will hold for weeks to come.
2. Daily Timeframe: Spotting Shorter-Term Trends and Reversals
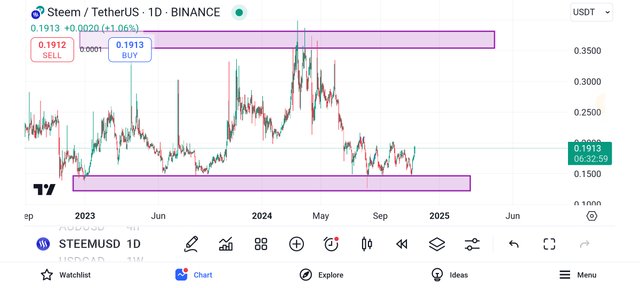
When it comes to the daily chart timeframe and the analysis I did on it, it helps me to notice the movements of the asset on the weekly basis. What do I mean by that, with the daily timeframe, it helps me to notice more shorter trends and to quickly notice any future reversal that might want to happen unlike the weekly chart timeframe. The daily trend helps give signal for entry most especially as it allign with the weekly trend. If you will see on the daily chart above, it is still on the bullish move which is in agreement to what the weekly chart was showcasing also.
- Refining Entry Points: When it comes to the finding the entry point with less noise, I think the daily timeframe does the job perfectly. Id I am able to know the weekly uptrend, I can use the daily chart to find my entry point most especially a buying opportunity as in this case of the image I shared above.
- Stop Levels: Talking About the Stop Level, I will also make use of the resistance levels I drew on the chart to place my stop losses. In fact the stop level on the daily timeframe will help to minimise risk even at the same time still in agreement with the macro trend.
- Profit-Taking: The profit taking as it will be picked in a way whereby if I see it approaching either the support or the resistance level on the daily chart, it is advisable for me to pick my profits or probably adjust my trailing stops in order to lock my profits.
3. Hourly Timeframe: Timing Precise Entries and Monitoring Short-Term Volatility
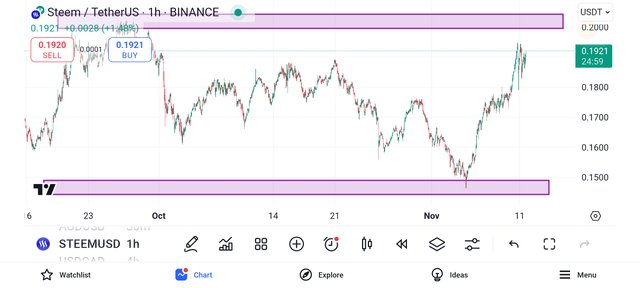
Moving to the Hourly Timeframe which I call it the scalper timeframe. It helps to give a more deeper detail about how the asset is actually performing. It is also used for precise entry points because it helps to give this optimal timing for trades.
- Refining Entry Points: The hourly chart above which is on a bullish movement can give me a signal for an entry since it also corresponds with both the daily and the weekly trends.
- Stop Levels: Talking about the Stop Level on the hourly timeframe chart, I will set it below the support levels below the intraday pattern. Even though setting levels using the hourly timeframe can really be prone to fluctuations most especially minor fluctuations.
- Profit-Taking: If I want to take my profit using the resistance levels, it will help me to make use of the short term price movements of Steem. But I will need to constantly monitor and adjust my profit target so that it still correspond with both the daily and the weekly trends.
Question 3: Adjusting Trailing Stops Based on Multi-Timeframe Analysis
I will be showing how to adjust Trailing Stop on different timeframe majorly on weekly and the daily timeframe using the Steem/USDT chart.
Weekly ATR - for Long-Term Safety
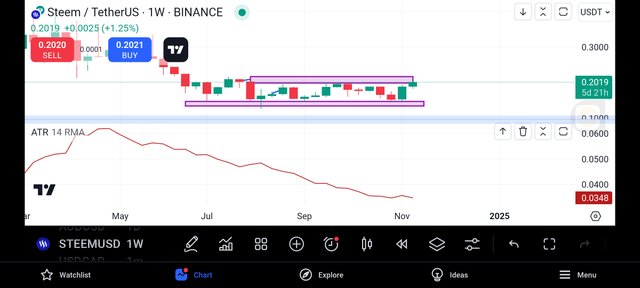
The trailing stop that will be set on the weekly ATR always help to give this more wider market movements and helps to give an edge over the short term fluctuations. This is majorly useful for the long term trades.
- Example;
As you can see in the chart above with the weekly chart on the Steem/USDT.
The current price of Steem was $0.1921
Let's say my weekly ATR is $0.05 for Steem
If I want to set a weekly ATR Trailing stop for the long term, let's take for example I enter the trade of Steem at that current price of $0.1921, then using my weekly ATR, the calculation for the trailing stop will be
$0.1921 - $0.05 = $0.142
So what it means is that as the price keeps moving up, the stop will be trailing at the price of $0.05 distance level so that even if there are larger price movements, it will not move me out of position early.
Daily ATR - for Closer Trend Following
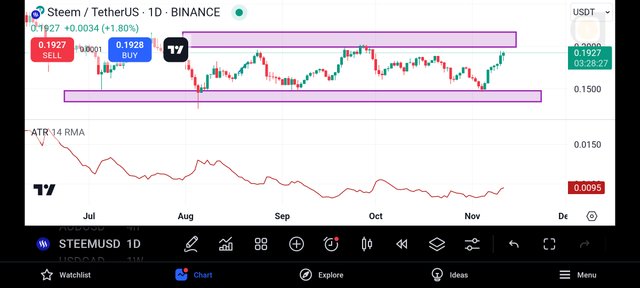
Same thing applies for daily ATR. Most of the time, I have come to discover that a trailing stop I set on the daily ATR is for short term price movements as compared to the weekly ATR.
Take for example my daily ATR for Steem at the current price of $0.2 is $0.02
Then setting my trailing stop for my daily ATR,
It will be;
$0.2 - $0.02 = $0.18.
This is the particular stop that I will follow closely as the price moves so that I can be able to close my trade sooner.
Takes for example, Steem prices move to $0.22,
Then my Weekly ATR based stop will be $0.22 - $0.05 = $0.17
Then the daily ATR based stop will be at $0.22 - $0.02 = $0.2
Question 4: Develop an Advanced Trading Strategy for a Bull Run
Alright, I will be explaining my strategy below;
Overview of Strategy
One of the things we need to understand at first is that the null market is always volatile and the price of asset is always moving in the upward direction. I will make sure that this strategy will depend on the points of confirmation across the trend. I will be using the multi timeframe analysis for this strategy.
Entry Criteria Using Multi-Timeframe Analysis
During Bull Run, one of the things that will help you to enter a position is the confirmation of the upward trend that has been confirmed on both the long term and the short term of timeframe.
For my Long Term - I will be making use of the Daily timeframe
For the short term - I will be making use of the Hourly and the 4 hour timeframe.
- Long-Term Confirmation (Daily Timeframe)
One of the things I will need for the strategy is the indicator that holds to point out long-term such as the moving average majorly the 50 day moving average and I will make use of the RSI and try to find the range of the 55-70.
- Short-Term Confirmation (4-Hour and Hourly Timeframes)
In order to get the Confirmation on the short-term, I will make use of the price pullbacks during the bull trend. I will find a good entry on the 4 hour RSI around the 40-50.
Then I will look for the candlestick pattern using the hourly timeframe for the pullbacks so that it will be a signal for the entry.
- Entry Signal Example
For my entry signal example also, I will make use of the daily timeframe to point out the trend making use of the 50 MA to be slightly above the 200 MQ and then the RSI will be in the range of 55-70.
Weekly ATR-Based Stop for Long-Term Stability
Then what I will use to do for this strategy is also to make use of the weekly ATR based stop for the long-term stability according to that which I have explained above.
- First I will calculate the weekly ATR that will be around 2× the weekly ATR.
Daily ATR-Based Stop for Moderate Adjustment
Then I will make sure that I calculate the daily
ATR to be at a trailing stop 1.5×.Then I will make sure I adjust the daily ATR stop per day so as the price increases.
4-Hour ATR-Based Stop for Short-Term Protection
I will calculate the 4 Hour ATR to be able to set a trailing stop at 1× which will just be slight below the current price of Steem. Why I will set this is so that I can be able to pick signal early for exit points.
Then I will constantly adjust the time as the 4 hour candle start to closes.
Exit Criteria
Talking about my exit criteria, I will make sure that I focus on locking my profit in case if there is any trend reversal.
The exit criteria will focus on capturing gains if there are signs of a trend reversal or if price targets are achieved.
- Using Trailing Stops as Exit Points is very important so that even if any trialing stop is been hit, my position will still be closed with profits already made. This will help me to reduce any potential losses.
- I will choose to make my profit targets to increase every 10% after every increment in order to still benefit from the bull run but at the same time still hit my profit targets.
Optimizing Gains and Minimizing Risks
There are some few measures I will definitely put in place to make sure that I optimise my gains and help to minimise my risks.
- Adjusting Stops Based on Volatility: whenever I notice any high Volatility, I will slightly increase my trailing stop to allow price swings.
- Regular Monitoring and Adjustments: Then I will make sure that I monitor both the 4 hour and daily chart constantly so that if there is any need for me to adjust my stops, I can do so.
Example Scenario
Entry: Take for example I enter Steem at $0.2 according to the daily trend.
Trailing Stops: Then my weekly ATR will be set at $0.17 (using the 2× weekly ATR).
My Daily ATR stop will be at $0.188 (1.5× daily ATR)
My 4 hour ATR stop will be at $0.19 ( 1× 4 hour ATR)
Take for example the price rise to $0.22, then I will adjust my stops to be at the upward direction.
Then I can exit at $0.23
Question 5: Precautions and Limitations of Trailing Stops and Multi-Timeframe Analysis
Even though Trailing Stops have proven to be a good strategy to lock your profit, it still have some limitations which I will like to talk about.
Limitations of Trailing Stops
- Sensitivity to Short-Term Price Fluctuations: Most of the time, Trailing Stops are always sensitive to volatility and this makes it to even lead to premature exit at times most especially when the bull trend is so strong.
- Reduced Profit Potential in Strong Trends: Even though it is a good tool that can help protect your profits and lock your gains, sometimes it can reduce your profit potential most especially during a very strong bull trend
- Adjustment Challenges: I have been in this shoe before. Sometimes it can really be difficult and quite challenging adjusting your trailing stops as the price of the assets keeps going.
Risks of Multi-Timeframe Analysis
- Conflicting Signals Across Timeframes: There are some instances that different Timeframe will give different signals which can really be conflicting.
- Complexity in Trend Interpretation: Another risk I will like to talk about is that not everyone knows how to interpret the trend which is a complexity and sometimes can be so overwhelming.
- Lag in Long-Term Indicators: Lastly, most of the indicators most especially the long term indicators can lack sometimes and so might be difficult to even notice trend reversal.
Tips to Avoid Premature Exits and Interpret Trend Reversals Effectively
- Adjust Trailing Stops Based on Volatility: This will be the first tip I will give. Try to always adjust the trailing stops based on the volatility movement of the asset and you can use that by combining the key support levels.
- Define Clear Multi-Timeframe Rules: Another thing that will help you is that you are able to establish clear Timeframe rules that will guide you and help you to stay focused across all the timeframe.
- Integrate Profit-Taking Strategies with Trailing Stops: Make sure that you use The profit taking strategy such as the incremental profit targets. Sometimes also if necessary, try to move your stop loss to Break even.
- Filter Noise Using Indicators: Most of the time, indicators always give us nosie, try to filter them. You can do so by not only depending on RSI but also using Trend lines.
- Avoid Over-Reliance on Shorter Timeframes: From my Short experience, I can say shorter timeframe are deadly and so don't rely on them. Try to check the long term trends every single time.
Thank you for this lecture, looking forward to more interesting and benefiting lectures in
I invite @lovelystar , @newekemini5 and @okere-blessing to drop a very constructive comments on this post and also to participate in this contest.
https://x.com/adenijiadeshin7/status/1856254696370888745?t=Gilx9h0vHn-zqagEE5aDaw&s=19
Nice to see a nice presentation of trailing stop technique and multi-timeframe analysis in this post. Some examples of practical application of your techniques would be more helpful. Good luck for the contest.