Crypto Academy Week 14 - Homework Post for @kouba01

INTRODUCTION
With the variety of indicators in the crypto and stock market, it’s important to know the functions and properties of a good number of them. In the previous class, we learned about the RSI momentum oscillator and it’s different parts and functions. After that lesson, I have been applying the RSI in chart readings especially to know overbought and oversold. I specifically used it once to maximize my profit in the doge coin market.
The current lecture is on a different type of momentum indicator - the MACD. I find this lecture particularly interesting because I did a little research on this indicator for my previous assignment. Now it’s time to delve into it properly.
What is the MACD indicator?
MACD stands for Moving Average Convergence Divergence. It was invented by Gerald Appel in 1979 and has been widely used in the stock market for over four decades.
It is a technical analysis tool that folllows market trends by considering the relationship between two moving averages of an asset’s price. This tool is a versatile one as it can be used as a momentum or trend indicator for scalping, intraday trading, swing trading and a number of other trading styles.
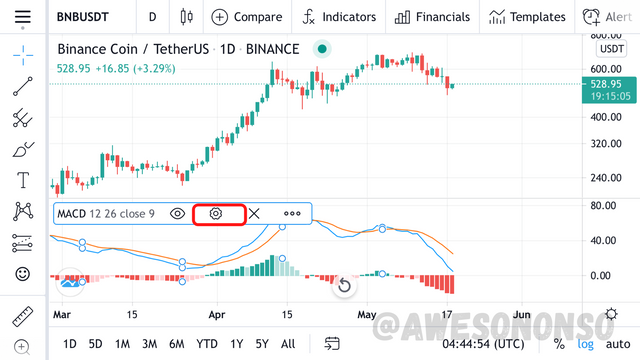
The MACD indicator consists of four parts which are the MACD line, the signal line, the histogram and the zero line. I will explain these one by one with the image below:
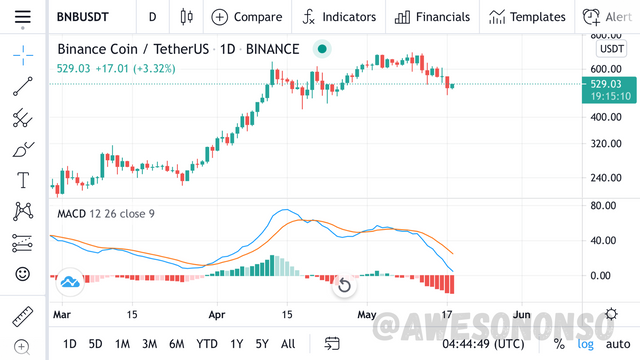
MACD Line :
This is the blue line shown in the chart. It is calculated by taking the difference of two different moving averages. By default, it is set to take the difference of the 12 period EMA and 26 period EMA of the underlying asset in this case BNB.
Signal Line:
The signal line is the orange line in the chart. It is the Exponential Moving Average of the MACD itself.
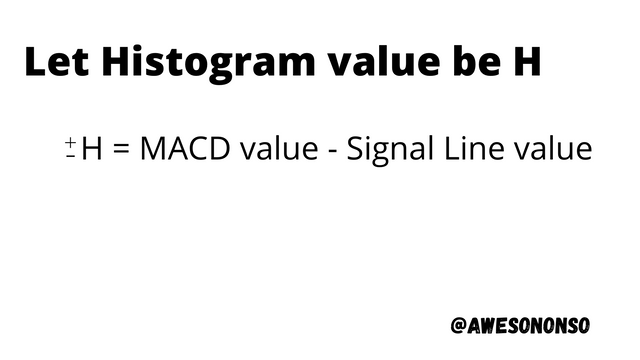
Histogram:
The MACD indicator is a type of tool termed an Oscillator of a Moving Average (OsMA). This is because it calculates the difference between and oscillator (MACD line) and its own Moving Average. This OsMA is usually drawn and represented as a histogram as shown in the chart above. The bigger the difference between the MACD and the signal line, the longer the bars of the histogram
Zero line:
This line is the backbone of the Histogram. It represents the zero value of the histogram.
Is the MACD good for crypto trading?
The MACD has been in use for many years in the stock market. Its introduction into the crypto market has proven to be useful in certain market situations.
With a number of different parts, the MACD is a really versatile tool. It functions as a great tool for detecting trends thanks to the fact that it incorporates moving averages. The different crosses of the lines help traders know the overall trend of a market. Also, the divergence signals can help traders predict the true movement of a market that otherwise would not have been seen on a candlestick.
The MACD is also a great momentum indicator. The histogram is great for knowing how fast a market is moving in its trend.
Which is better, MACD or RSI?
The MACD and RSI are both impressive tools that most traders rely on. Trying to compare them was actually tricky for me. I asked a couple of traders of their preference and most of them preferred the RSI.
I did my own research and discovered that the two indicators had their preferred market conditions which I would explain below:
MACD
The MACD is a much more versatile tool that incorporates moving averages in its calculations. Moving averages are really helpful for determining overall trends in a market. The MACD can, therefore, be used on all time frames depending on the underlying asset. In long term markets, the EMA values can be increased to get a wider view of markets in the long run.
The MACD is much reliable than the RSI when it comes to trending markets. Trending markets are markets that are either bullish or bearish. These markets may fluctuate but are overall one directional. Large caps assets can be assessed with the MACD.
RSI
The RSI does not give a lot of signals. Still, it follows the popular say that more is less. It gives less signals but more accurate ones. For example, the overbought and oversold signals on the RSI are clear signals to sell and buy respectively.
The RSI performs a lot better than the MACD in sideways markets. Sideways markets are markets that are neither bullish not bearish. That is, they are not one directional and are stable. Just as stated by Investopedia the MACD is really not reliable in these types of markets. The RSI however, can be used to locate those tiny buy and sell signals.
My opinion
Comparing both of them, I prefer the MACD to the RSI. The MACD has different indicators that can individual give reliable signals. If the MACD and signal lines do not cross, the MACD might cross the signal line. Also the histogram might show trend movements faster than either of the lines. This opens up a lot of options for traders. Still, it is important to keep in mind that no indicator is 100% accurate so we should use the MACD with caution.
How to add the MACD indicator to the chart
As usual, I will be using TradingView from the web.
To add MACD indicator to a chart:
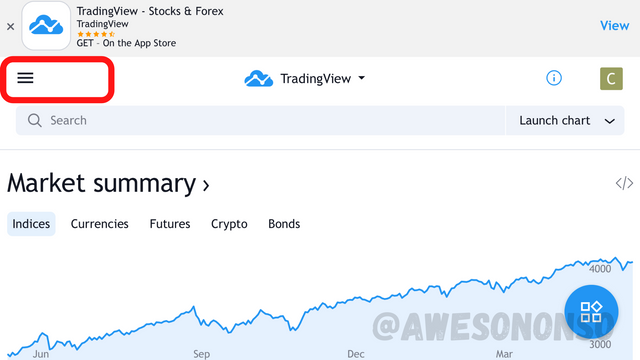
Step 1: Visit https://www.tradingview.com/
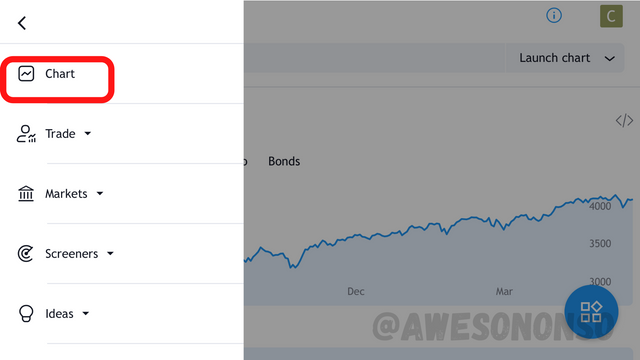
Step 2: Click on the corresponding menu button.
Step 3: Select “Chart”.
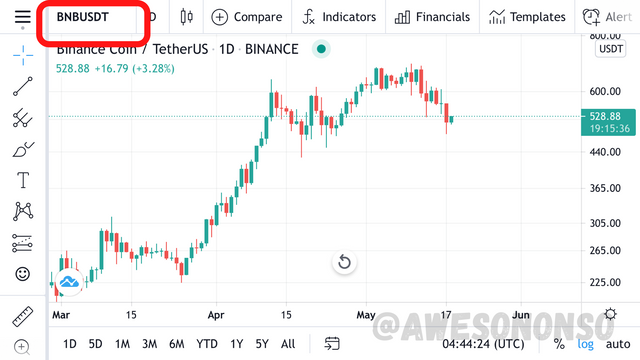
Step 4: Select a pair. I chose BNB/USDT
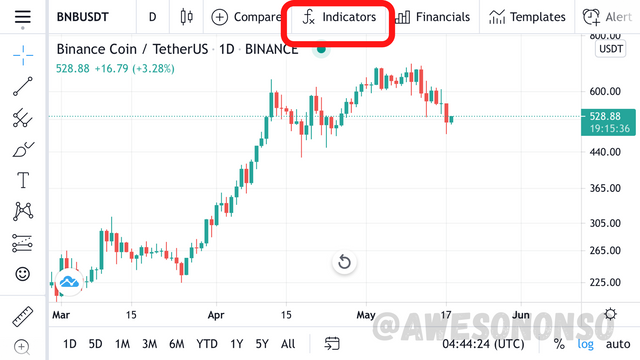
Step 5: Click “fx indicators”.
Step 6: Search macd and select “MACD”.
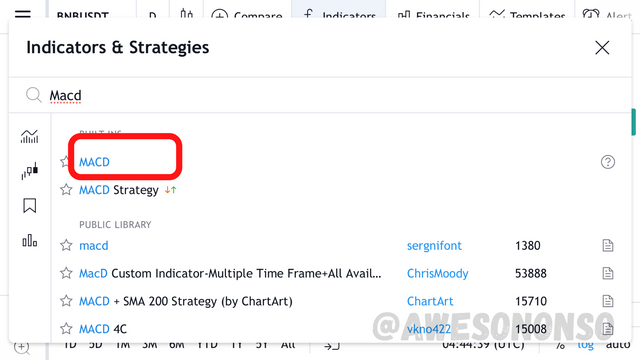
Step 7: The MACD indicator comes up.

The MACD settings:
To access the MACD settings, touch the indicator and click on the corresponding settings button.
Now the settings come up. Let’s look at the “Inputs” tab:
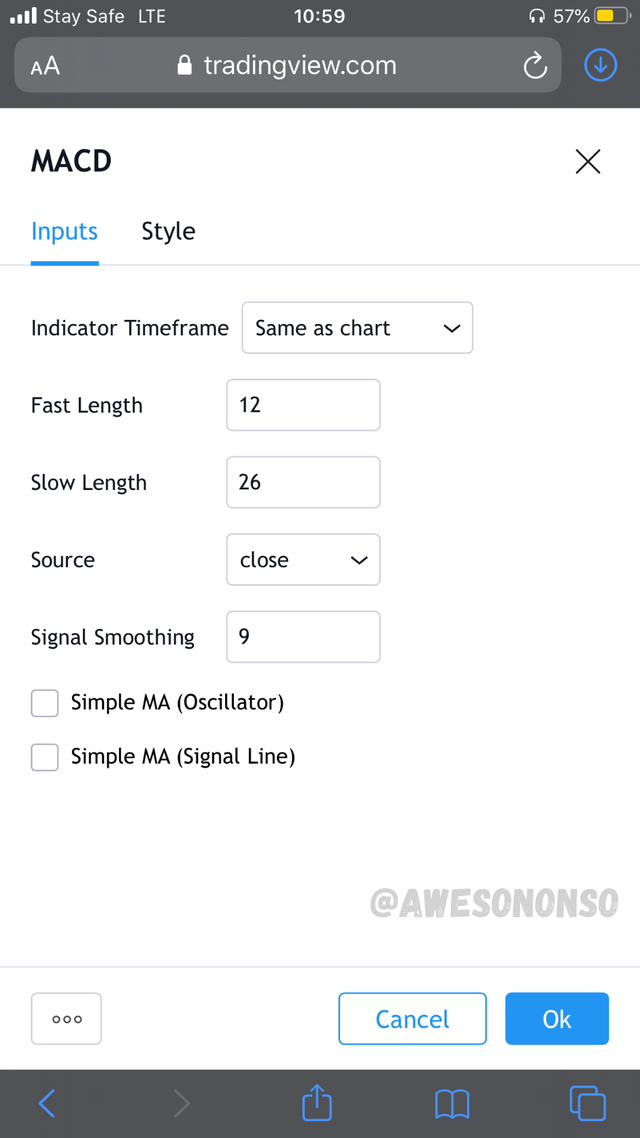
Indicator Timeframe is how much time is considered on the indicator relating to the chart.
Fast Length is the period of the Fast EMA considered for the MACD line.
Slow Length is the period of the Slow EMA considered for the MACD line. It is normally supposed to be more than the Fast Length.
Source is what price the indicator is based on.
Signal Smoothing is the period for the signal line.
Simple MA (Oscillator): When this box is checked, Simple Moving Averages are considered for the MACD line. Otherwise, Exponential moving averages are considered.
Simple MA (Signal Line): When this box is checked, the Simple Moving Average of the MACD is considered for the signal line. Otherwise, the Exponential Moving Average is considered.
For the SMA oscillator and signal line options, I would prefer to keep them unchecked because EMAs react faster to trends than SMAs.
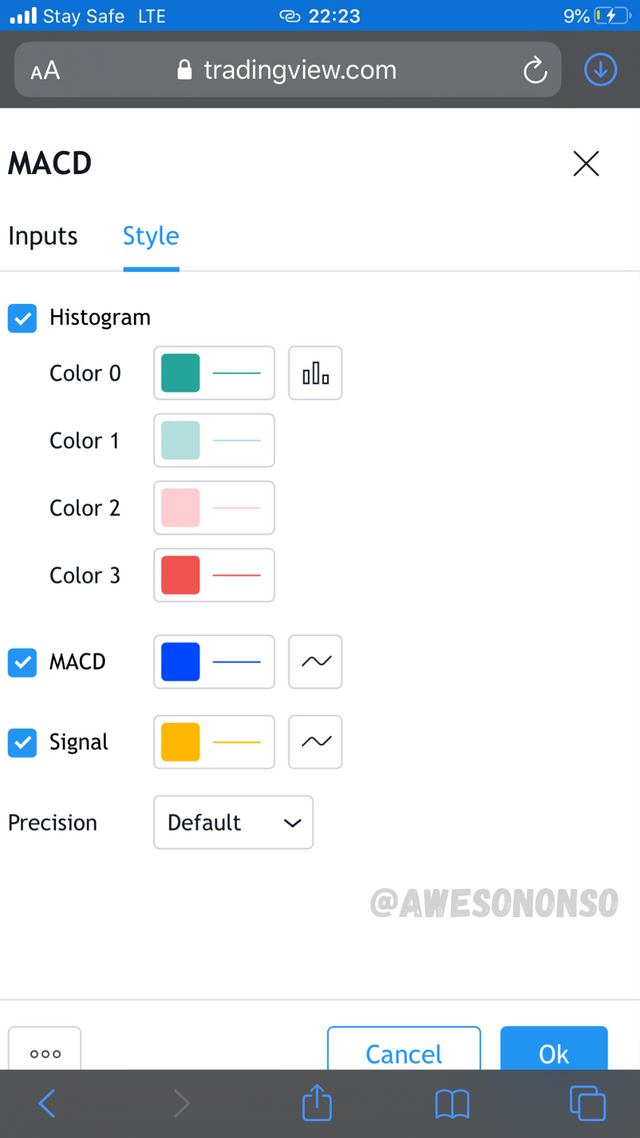
The style tab is for configuring the indicator according to one’s taste and preference.
How to use MACD with crossing MACD line and signal line and with the crossing of the zero line
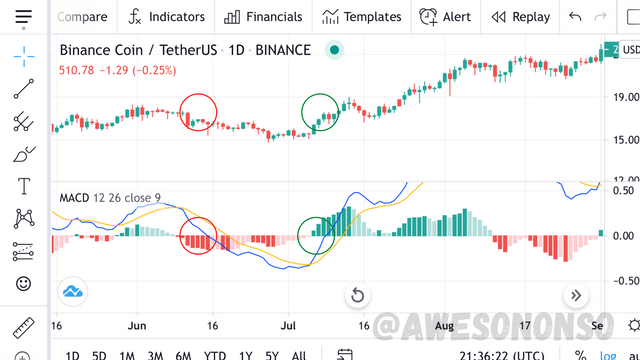
Crossing MACD line and signal line
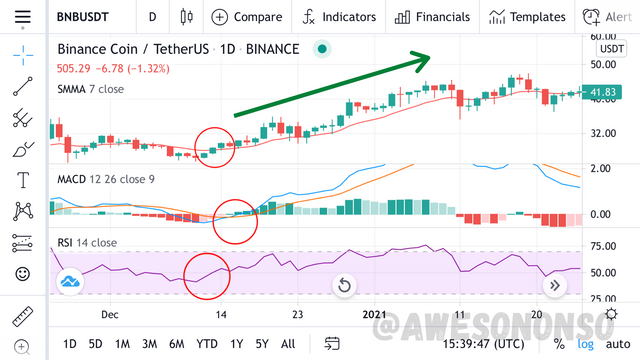
The MACD line can cross the signal line from two different directions. When the MACD line crosses the signal line towards a downward position, it signifies a possible sell or short signal. However, when the MACD line crosses the signal line towards an upward position, it signifies a possible buy or long position.
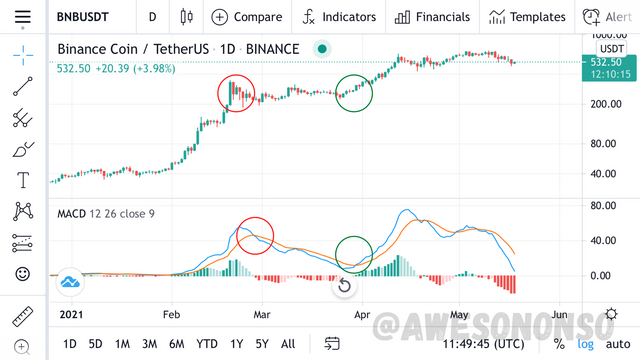
The chart above is that of the BNB/USDT pair. The red circle shows a downward cross that was followed by a gradual price decrease. The green circle shows an upward that is followed by a gradual price increase.
Crossing of the zero line
The MACD line also crosses the zero line to signify a possible trend. When the MACD line crosses the zero line towards a downward position, it signifies a possible sell or short position. Also, when the MACD line crosses the zero line towards an upward position, it signifies a possible buy or long position.
Still on the BNB/USDT chart. The red circle shows a downward cross that was followed by a bearish movement in the price. Similarly, the green circle shows an upward cross that was followed by a bullish movement in the price.
How to detect a trend using the MACD and how to filter out false signals
There are several ways to find trends in a market with the MACD. I’m going to be talking about these ways:
MACD and signal line/zero line Crossovers
As I mentioned and illustrated above, crossovers between the MACD and signal line or zero line are signals of trends.
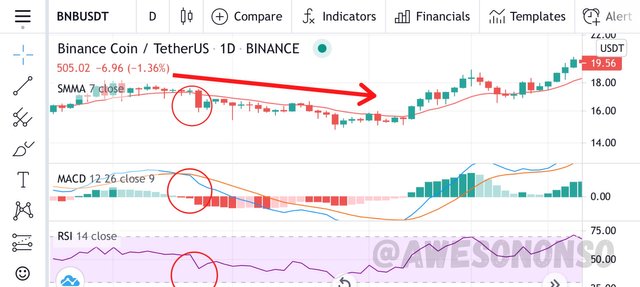
Histogram Reversal
The histogram on the MACD is not just for show. The bars can show trends by the how deep their slope and length is. Longer bars during a bullish market shows a strong trend. The bars reduce or converge when the market begins to correct. This is the same with bearish markets. The convergence is an important signal becomes it comes before the MACD and signal lines cross.
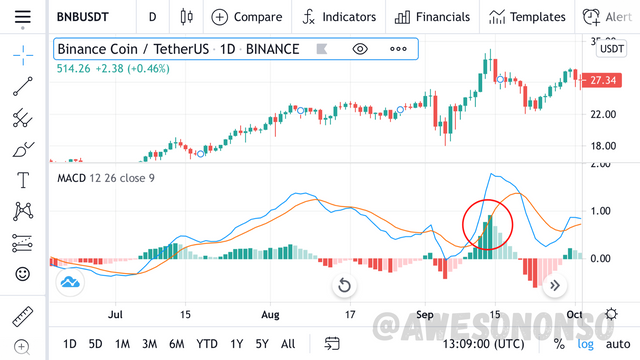
From the chart above, the bars on the histogram reduce and led to a downward movement. This came before the cross which happens at the zero value.
Recall: Histogram value is zero when MACD line equals signal line.
Divergences
Just like the RSI, the MACD can go against the normal chart movement causing a divergence. This type of signals can mean trend reversals in most cases. There are two types of divergences that can occur:
- Bullish divergence: This happens when the chart shows a pattern of lower lows but the MACD line moves in an upward direction. This would mean that there would likely be a reversal from a downtrend to an uptrend.
The pattern of lower lows is not followed by the MACD.
- Bearish divergence: This is the reverse of a bullish divergence. It happens when the chart shows a pattern of higher highs but the MACD moves in a downward direction. This would likely lead to a reversal of an uptrend to a downtrend.
The pattern of higher highs is not followed by the MACD.
How to filter out false signals
Just like every indicator, the MACD is not perfect. There are instances of false signals that send traders in the wrong direction. Still, there are things that can be done to improve its accuracy and flush out false signals.
1. Changing the settings in volatile markets:
There is always noise in volatile markets. To make the MACD more reliable in this condition we can change the settings to shorter periods.
2. Combining the MACd with the RSI and an SMA:
Combining indicators has been a way of getting better trading signals. In the case of the MACD we can combine it with the RSI and SMA. The RSI would show the future movement of prices while the SMA and MACD would confirm it. RSI is a leading indicator while SMA and MACD are lagging indicators.
For a potential bullish movement, the RSI would be above 50 while a candle stick would be crossing above the SMA. The MACD would confirm it with the MACD line going above the signal line and the histogram forming green bars.
A buy confirmation.
For a potential bearish signal, the RSI would be in a downtrend below 50 while a candle stick would be crossing beneath the SMA. The MACD line, in this case, would be going below the signal line and the histogram would be forming red bars.
A sell confirmation
3: Using the MACD with the Volume-Weighted Average Price indicator:
The VWAP is an indicator that considers the price and volume of an underlying asset. The VWAP is normally used for intraday trading and can be combined with the MACD for better success. I’ll show how to combine them below:
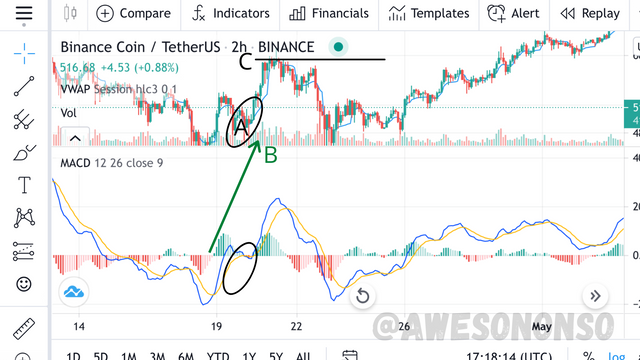
Using a 6 minutes chart, I brought up the VWAP indicator and a volume indicator too. At point A where the price is above the VWAP line, the MACD begins to show green bars meaning a bullish movement. You can see the volume increase at B. We can open a long position and keep it open till the price touches the VWAP at C. Then we take profit. Notice that where the price touches the VWAP corresponds to the longest bar on the histogram. That’s a good way to maximize profit.
How can the MACD indicator be used to extract points or support and resistance levels on the chart?
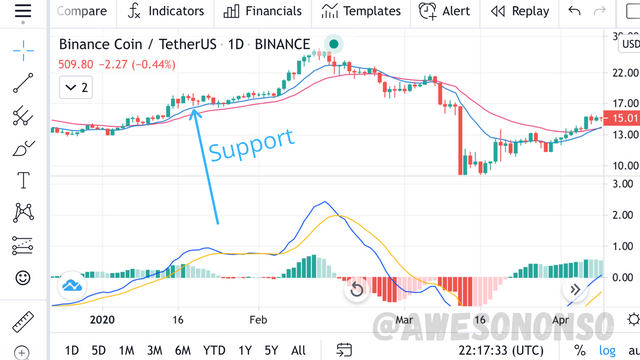
It is a common but controversial belief that moving averages form resistance. Whether it be a fact or because of the value attached to lines, moving averages always track the movements of prices with EMAs moving faster than SMAs. To extract resistance and support from the MACD, we need to bring up the EMAs that the MACD line is calculated. Let’s use the default which is 12 and 26 for the fast and slow respectively.
On the candle stick chart, the blue EMA is the 12 period EMA while the red EMA is the 26 period EMA. The 12 period EMA mostly does all the work of resistance and support.
Notice in the picture below, that during the uptrend, the two EMAs follow right below the candle sticks with the 12 period EMA acting as the support. The price constantly tests this EMA line before continuing in the uptrend.
After breaking the 12 period EMA, there is a clear downtrend. The Fast EMA follows right behind forming a resistance right above the price and the slow EMA follows sluggishly above it.
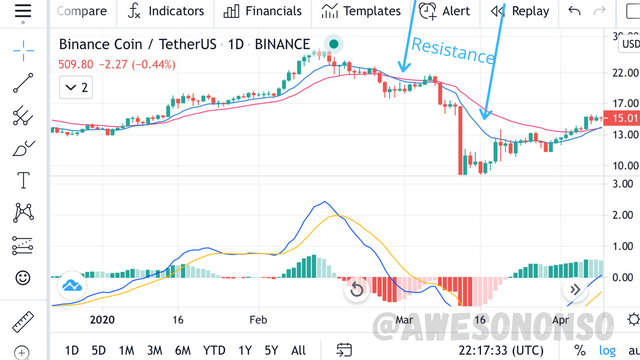
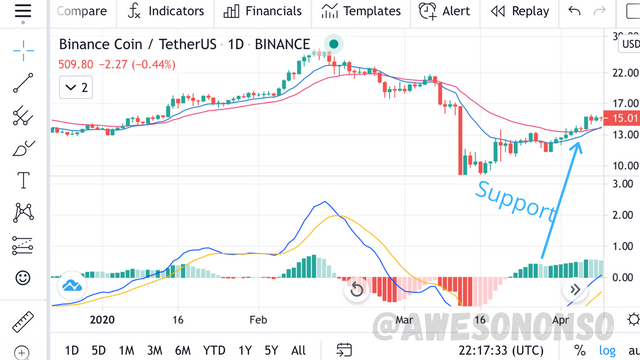
Once that resistance is broken, an uptrend begins again.
Review the chart of any pair and present the various signals from the MACD.
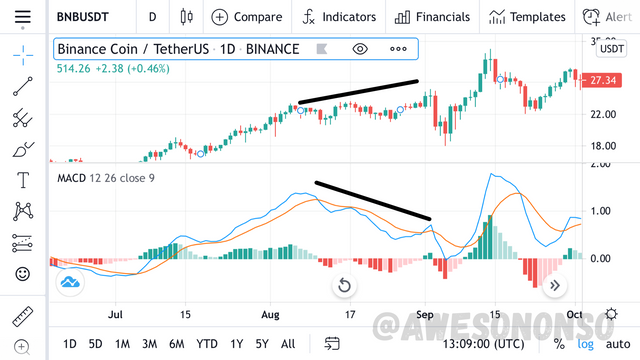
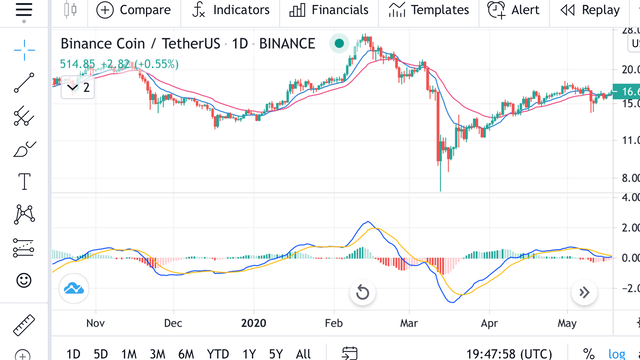
I have been using BNB/USDT pair since so I might as well use it now too. Let’s look at a chart from 2020.
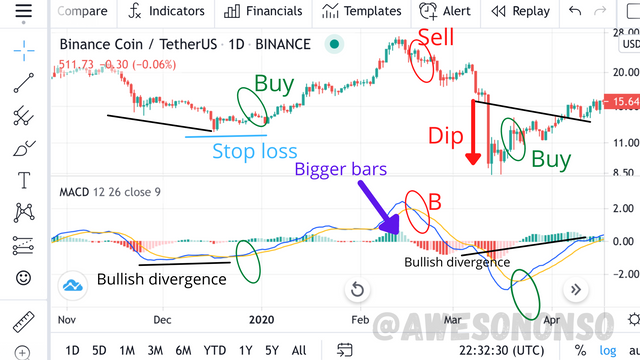
A good entry point would be at the point of a bullish divergence as shown. The MACD has just crossed the signal line which is a good confirmation of the signal. The stop loss would be a little below the entry with just enough space to give the trade some swing. I will open a buy position and watch the price go all the way up.
The histogram green bars get bigger but I wouldn’t sell till I see a confirmation signal. When the MACD line crosses the signal line at B, that would show a good time to sell and take profit. Notice the dip as the MACD crosses the zero line.
Maintain the sell position until the MACD crosses the signal line again giving a buy signal. The bullish divergence would be a great confirmation to hold that buy position for a while.
CONCLUSION
The MACD is good but has its faults just like any other indicator. I used BNB in my examples because it is a large cap asset and MACD are much reliable when it comes to large caps. The MACD signals have proved to be really helpful trading aids but it is still important that all traders stay cautious while trading.
Special thanks to @kouba01
Hello @awesononso,
Thank you for participating in the 6th Week Crypto Course in its second season and for your efforts to complete the suggested tasks, you deserve a 9.5/10 rating, according to the following scale:
My review :
Excellent work in form and content. Your responses contain related ideas and are carefully analyzed. For the issue of extracting resistance and support levels, a small hint on the role of histogram in this context is missing.
Thanks again for your effort, and we look forward to reading your next work.
Sincerely,@kouba01
Thank you professor.
I really find your lessons enlightening and helpful in my career so I try my best to understand them. I would like to know what I missed maybe after the general correction is done.
Thanks again.