Crypto Academy Week 15 - Homework Post for @yohan2on

INTRODUCTION
As we learnt in the previous class, scalp traders take advantage of small time frames and basically scalp for little profits. They never hold positions for long and are always on watch in case things go south.
What about traders that prefer time frames that are not so short with bigger profits? These type of traders can try a style of trading called Swing Trading.
In this assignment post I would explain the swing trading style and give an illustration of how to perform it. Let’s begin...
What is Swing Trading
Swing trading is a type of trading where positions are held for a day or more. This type of trading is more or less a medium time frame trading style because it is longer than day trading but not as long a position trading.
Typically, swing traders take advantage of volatility in the market. They identify possible trends and open positions in order to make profits from the swings of the asset’s price. Swing lows are signals of a long positions hike swing highs are signals of a short position.
Advantages of swing trading
Not time consuming: This type of trading is convenient for people who might not have the time to scalp. I find it particularly useful because it is suitable for me as a full time student.
Wider profit possibilities: Swing traders have opportunities to wider profits unlike day traders. They open positions to hit targets that are distant from the starting point. This clearly expands their profit margin.
Disadvantages of swing trading
Overnight losses: Crypto markets are open 24/7. Swing traders do not normally their trades and are prone to a lot of unforeseen price movements at anytime of the day.
Emotions: Swing traders are affected by their emotions a lot. They might see markets begin to move in an opposite direction and so they change their positions. Sometimes they are moved by news or social media noise.
Types of swing trading
There are 4 common types of swing trading namely:
Reversal Trading: This is a type of trade that is opened according to a change in trend direction.
Retracement Trading: This type is placed when the prices retrace temporarily before the trend continues.
Breakout Trading: This type is opened as early as possible after the price of an asset breaks or is about to break a key resistance.
Breakdown Trading: This type is opened as early as possible after the price breaks of is about to break a key support.
Swing Trading Method on BTT
For my illustration I’m going to be using BitTorrent (BTT) on TradingView. Among the types of swing trading mentioned above, we are going to be looking at a breakout trade using the popular Triple Screen Strategy.
The Triple Screen Strategy, which was invented by Dr. Alexander Elder, is a technique that considers three different time frames for a single asset price movement. The strategy was formulated on the fact that no single indicator can offer accurate signals on a single time frame. The use of different time frames helps to confirm a buy or sell action.
Below is a summary of how the signals would come according to Dr. Elder:
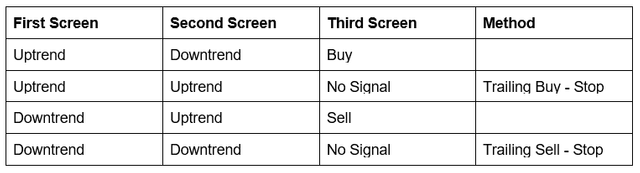
Now let’s look at BTT:
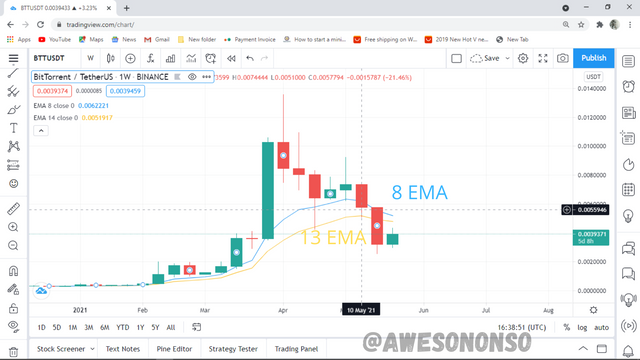
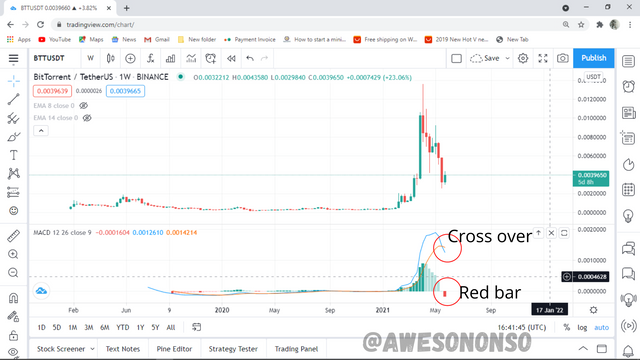
First screen: Weekly Chart
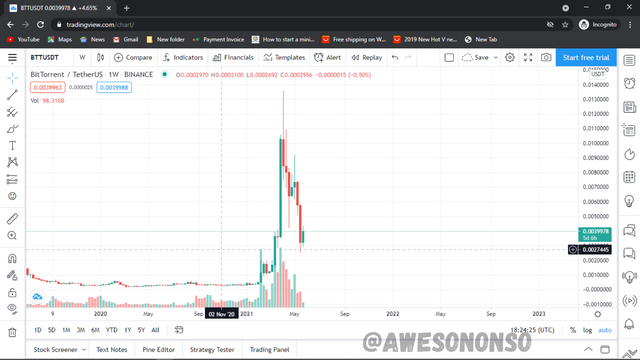
According to Dr. Elder, the first screen would use a momentum indicator. I normally like to use an 8 period EMA because it detects trends really fast. I also used the 13 period EMA. From the image below, the two EMAs are above the candlestick which means a clear downtrend.
I also used the MACD indicator. From the MACD indicator, the MACD line has crossed the signal line towards a downward position. This is a clear downtrend signal. The histogram also confirms the signal with the red bar that is forming.
Second frame: Daily chart
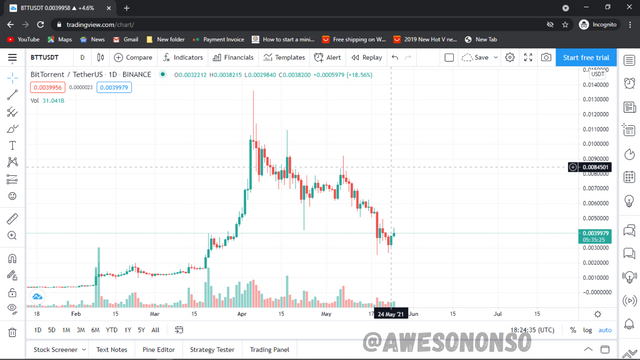
The second frame is used to determine market bias. The market bias in this case is the market direction to be traded. I have to use an oscillator to know when the market is either about to continue in the trend after leaving an overbought or oversold region.
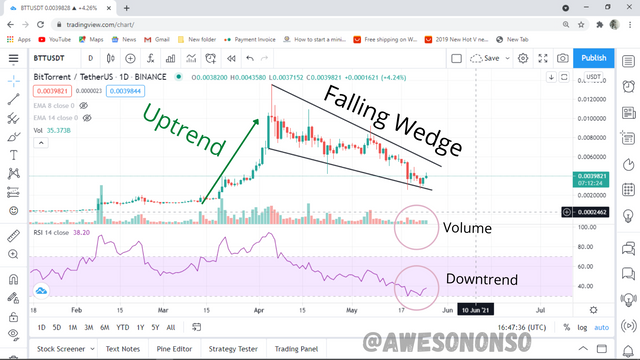
First of all I noticed a falling wedge patter. It’s clear because the pattern is characterized by lower highs and lower lows. This type of falling wedge is a continuation signal from the uptrend marked. This clears bias and shows that the intended downtrend is actually a form of retracement.
The volume retraction also shows that the major price fluctuations are over.
Because I need an oscillator in this case, I used the RSI tool as shown above. The RSI shows that the price is still in a downtrend trend as it is below 40-50. This might not be a good place to open a position. I would determine that in the next frame.
Third frame: 4-hour chart
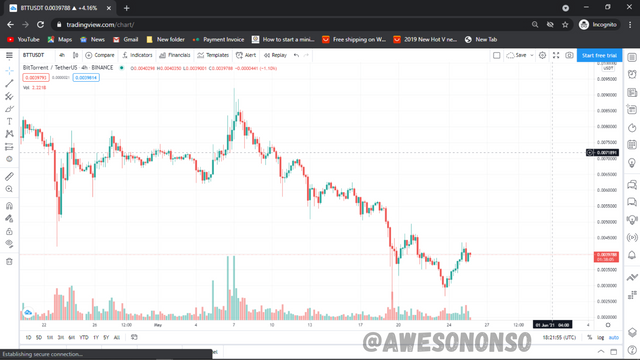
The third screen is where all the action happens. This is where we determine the entry and exit point and where to place our stop loss.
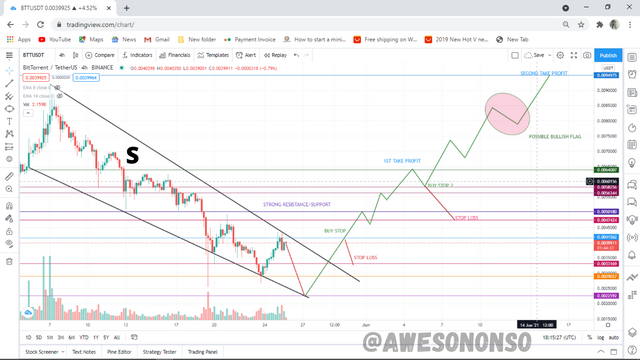
From the chart above, we also notice the wedge pattern formed. The wedge is a continuation wedge that signifies that the market will still return to its uptrend. The intended trend is a breakout trend so I have to wait for the price to test or break a key resistance.
I let the market move until it touched a previous high at 0.0041562 USDT where I placed my buy stop order. The take profit is at 0.0064007 USDT where the market had initially retraced from the uptrend after breaking the support at S. I placed the stop loss at 0.0033169 USDT making the profit-loss ratio roughly 2:1.
If I get to my take profit after a couple of swings, I would wait for the price to pull back from the resistance a little bit. I would then place a second buy order just below the resistance 0.0058256 USDT. Most times after a wedge pattern, the trend continuation is more than the previous trend. That said, I am optimistic with setting my second take profit above the highest price at 0.0094975 USDT. The price might just paint a bullish flag after hitting the highest price but that Is just part of the swing to my take profit. The stop loss in this case is at 0.0047424 giving a profit-loss ratio of roughly 2:1.
CONCLUSION
The swing trading strategy needs a lot of practice and diligence in order to master it. This type of trade is really ideal because it gives people the time and opportunity to do other things in life. The convenience, however, should not make traders neglect the risky nature of cryptocurrencies I’m general.
Special Thanks to @yohan2on
Hi @awesononso
Thanks for participating in the Steemit Crypto Academy
Feedback
This is very good content. Thanks for demonstrating your understanding of Swing trading in a clear and detailed way.
Homework task
9
Thank you for the review.
@yohan2on @kouba01
Please review. My post is almost 4 days old without a review
Please check it out
Thanks again!
Hello,
@kouba01
@yohan2on
It’s been 3 days
Review please