[Crypto Trading Strategy with Triangular Moving Average (TRIMA) Indicator] - Crypto Academy / S6W4 - Homework Post for professor @fredquantum.

Question 1
What is your understanding of the TRIMA indicator?
TRIMA Indicator
The triangular moving average (TRIMA) is a variant of the simple moving average indicator that is smoothed twice to reduce the indicator's reaction to randomized price movement, thus generating smooth and clear trade signals. Ideally, the simple moving average indicator values are derived from the average closing price of previous price data within a given interval, thus resulting in a representation of price lags and reaction to irrelevant price movements quickly. This in turn generates distorted and false signals that can trick traders and investors into taking wrong trading decisions.
The TRIMA indicator works by applying a double smoothing function generated from its calculation to its simple moving average values. This function ensures that lags and random price fluctuation are ignored by the TRIMA indicator, and this results in a smoothened representation of the indicator data in relation to price movement, making the TRIMA an ultimate choice in identifying trends, trend structure, support, and resistance areas using the average indicator. The TRIMA indicator was widely used in stock market trading before its slow transition and adoption within the crypto ecosystem.
Similar to other types of moving averages, the TRIMA indicator represents trends directions using the angled slope of its oscillating line and the crossover of price above or below the indicator line, such that a bullish trend can be easily identified with the upward angle slope of the indicator line and price movement cross above the TRIMA indicator line without alternating. While a bearish trend can be identified with the downward angle slope of the indicator line and price movement cross below the TRIMA indicator line without alternating.
Cryptocurrency markets are considered one of the most volatile traded markets and as such high fluctuation of price movement is encountered because of liquidity and manipulations. Using a trend-based indicator like TRIMA will reduce the risks involved by filtering out false inputs and generating smooth and clear trade signals.

Question 2
Setup a crypto chart with TRIMA. How is the calculation of TRIMA done? Give an illustration. (Screenshots required).
Adding TRIMA Indicator to Price Chart
To add the TRIMA indicator to a price chart, access any price chart platform that supports the use of the indicator and access the price chart. For this illustration, I chose the tradingview platform.
First, visit Tradingview's website and access the price chart.
On the price chart, click on the indicator icon to add the indicator of choice. Then search for the indicator using any relevant keyword like TRIMA, Triangular MA, etc.
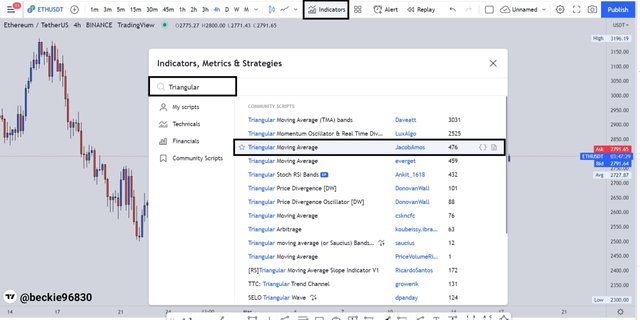
Next click on the indicator to add it to the price chart.
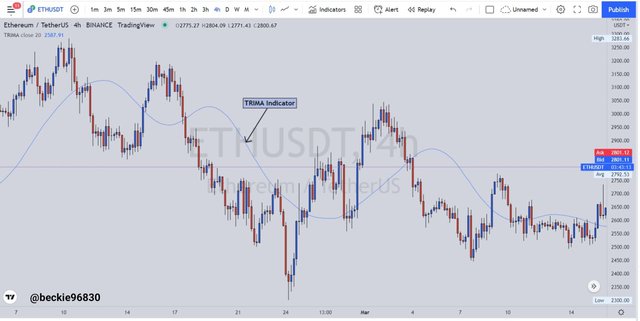
Hover on the indicator name and click on the settings icon to configure the indicator to the desired configuration.
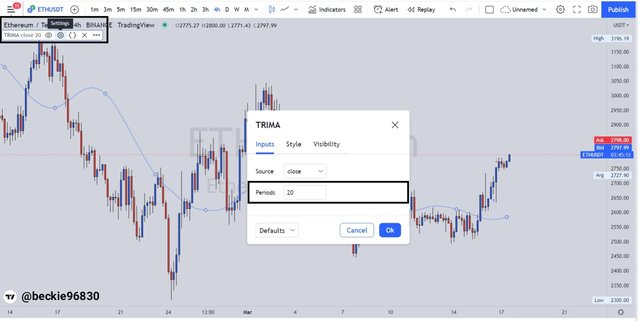
The TRIMA indicator has a default period setting of 9, which is ideal for short-term trading systems like scalping. Though shorter indicator period setting in some cases generates distorted signals. But with a higher period setting like 20, 21, 25, 50, etc the indicator generates a better indication of possible price movements when compared to the short-term period of 9. I chose a period setting of 20 for this indicator, which is more reliable for clearer indications.
TRIMA Indicator Calculation
The triangular moving average (TRIMA) has a mathematical expression that represents its calculation, where the smoothing is done on the SMAs. To calculate the TRIMA, we have to first calculate the SMA value within a given interval. The TRIMA expressions are as follows:
SMA value
Since SMA is derived from average price with a given interval, The value of SMA is calculated thus:
SMA = (Price1 + Price2 + Price3 + Price4 + .... Pricen) / n
Where:
Price = price of an asset within intervals 1-n
Pricen = last recorded price within the period of observation
n = Period of observation used.
With the SMA formula above, the TRIMA indicator values are thus calculated as an average of the SMAs used, the expression is as follows:
TRIMA = (SMA1 +SMA2 + SMA3 + SMA4 .... + SMAn) / n
Illustration
Assuming the SMA values of an ETH over a period 6 is as follows 2500, 2550, 3000, 3140, 2600, 3500. The TRIMA indicator value will be:
TRIMA = (2500 + 2550 + 3000 + 3140 + 2600 + 3500) / 6
TRIMA = 17,290 / 6
TRIMA = 2881.67
Question 3
Identify uptrend and downtrend market conditions using TRIMA on separate charts.
TRIMA Indicator And Trends
The TRIMA indicator predicts trends and helps investors and traders identify possible areas of buying and selling opportunities. The TRIMA indicator identifies the market trend with the location of the indicator line (either above or below the price) and with the angle slope of the indicator line, which usually moves in the same direction as the identified trend. Though, the ability of the TRIMA indicator to predict trends and generate valid trade signals depends on the indicator settings and the trading system used. I will further explain TRIMA trend identification below:
Identifying Uptrend using TRIMA Indicator
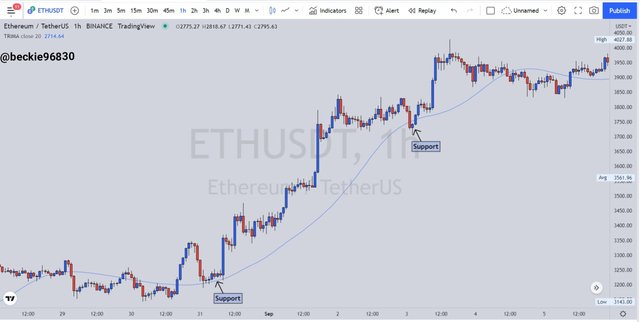
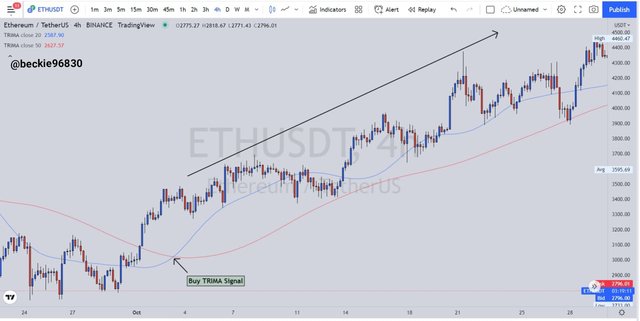
The TRIMA indicator identifies the bullish trend with price movement crossing and trading above the indicator line upward. To confirm the trend, the angle of the indicator line should be moving upwards in the same direction as price movement without alternating. To illustrate this, consider the chart below:
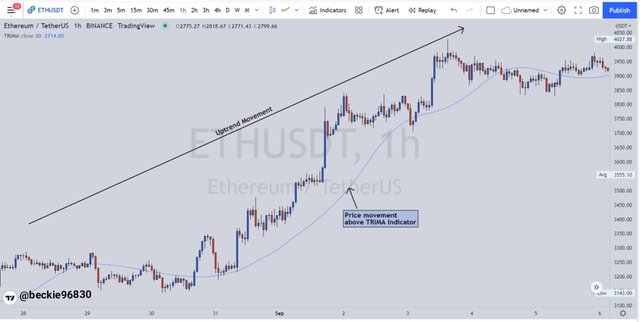
Observing the ETHUSDT chart above, the TRIMA indicator highlighted the bullish trend with the crossover of price movement above the indicator line, and the angle of the indicator line correlating with the upward movement of price. As observed, the bullish structure was maintained above the indicator line after the crossover.
Identifying Downtrend using TRIMA Indicator
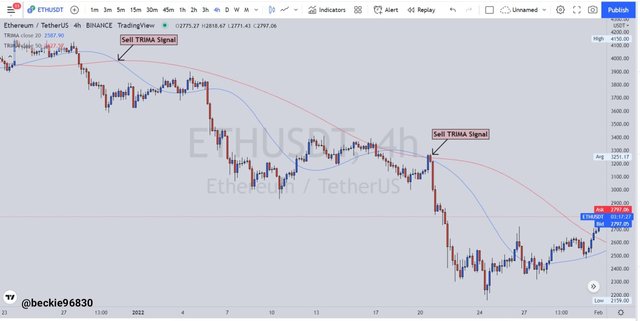
The TRIMA indicator identifies the bearish trend with price movement crossing and trading below the indicator line downward. To confirm the trend, the angle of the indicator line should be moving downwards in the same direction as price movement without alternating. To illustrate this, consider the chart below:
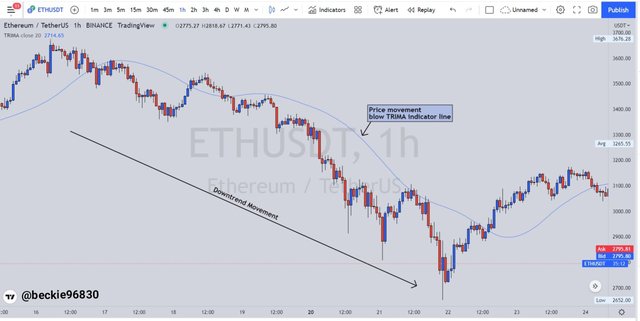
Observing the ETHUSDT chart above, the TRIMA indicator highlighted the bearish trend with the crossover of price movement below the TRIMA indicator line, and the angle of the indicator line correlating with the downward movement of price. As observed, the bearish structure was maintained below the indicator line after the crossover.
Question 4
With your knowledge of dynamic support and resistance, show TRIMA acting like one. And show TRIMA movement in a consolidating market. (Screenshots required).
TRIMA indicator as Dynamic Support and Resistance
The concept of support and resistance is created by the reaction of market participants (buyers and sellers) around sensitive price zones, such that the movement of price can reject from or move through these Price zones. Strong levels of support and resistance are indicated by how well price has reacted around those areas and how often it held price (if not broken through).
The dynamic resistance and support is a type of resistance and support level that is comprised of an oscillating line (using moving averages) that indicates the various dynamic points of resistance and support. This type of S&R is characterized by its close movement to price formation. The TRIMA indicator is a good example of dynamic support and resistance indicator. I will explain further below:
Ideally, When price movement cross and trades above the triangular moving average (TRIMA) line, the upward movement uses the TRIMA indicator line as a dynamic support level, thus the price movement bounces off the indicator line to continue its upward movement after a retracement/pullback, thus allowing trading and investor to capitalize on the potential buying opportunities. Consider the chart below for further illustrations:
Observing the ETHUSDT chart above, the TRIMA indicator supports the upward movement of price by serving as dynamic support to price movement. When price approaches the TRIMA line, it reacts by rejecting the TRIMA line and continuing with its original trend movement which is bullish.
similarly, when the price movement cross and trades below the triangular moving average (TRIMA) line, the downward movement uses the indicator line as a dynamic resistance level, thus the price movement bounce off the indicator line to continue its downward movement after a pullback, thus allowing trading and investor to capitalize on the potential selling opportunities. Consider the illustration below:
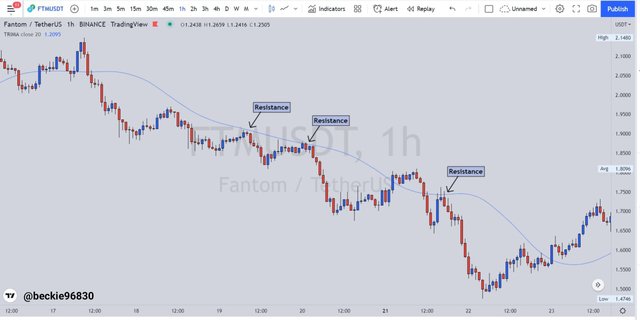
Observing the FTMUSDT chart above, the TRIMA indicator complements the downward movement of price by serving as dynamic resistance to price movement. When price approaches the TRIMA line, it reacts by rejecting the TRIMA line and continuing with its original trend movement which is bearish.
TRIMA Indicator in Consolidating Markets
Consolidating Markets indicates the absence of a trending market condition as price trades between a defined resistance and support level, thus indicating an equilibrium state between demand and supply of an asset traded. Consolidation results from low trading volume and low momentum in the markets as the participants are indecisive on where to take the price.
In Consolidating Markets, the TRIMA indicator alternates with price in a flat-like representation, this confirms the absence of a trending condition as price trades within a defined resistance and support level because of low volume and momentum. To illustrate this, consider the chart below:
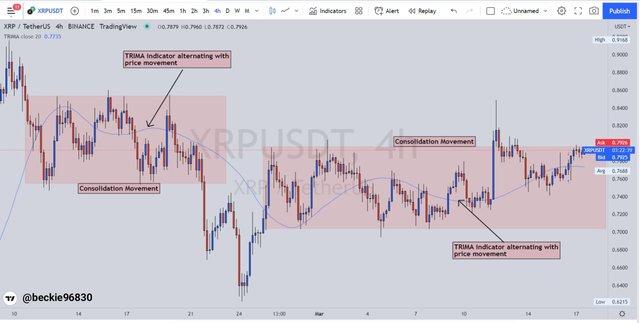
Observing the chart above, the TRIMA indicator can be seen alternating with price movement in a flat-like representation as price trade within a range of resistance and support. It's often advised to stay off when the price is ranging to avoid liquidation. A breakout from the consolidation can be confirmed when price movement crosses above or below a resistance or support and the TRIMA indicator intercepts with price without alternating afterward.
Question 5
Combine two TRIMAs and indicate how to identify buy/sell positions through crossovers. Note: Use another period combination other than the one used in the lecture, explain your choice of the period. (Screenshots required).
Combining Two TRIMA Indicators
Combining Two TRIMA indicators is a trading crossover strategy that utilizes two TRIMA indicators with different period settings, with one having a shorter setting and the other a longer period setting. Ideally, the TRIMA indicator with a shorter period setting reacts faster to price movement while the TRIMA indicator with a longer period setting reacts slower to price movement.
The combination of the two TRIMA indicators is used by traders to identify buying and selling opportunities in a traded market. For this illustration, I chose the 20 and 50-period TRIMA because of how smooth they represent price change in the short to medium term.
Buy TRIMA Crossover
When a TRIMA with a smaller period (20) setting crosses above the TRIMA with a higher period (50) setting it is considered a bullish signal, hinting at buyers being in control of price movement. A buy trade can be executed after the crossover and price cross and trading above the TRIMA line. To illustrate this, consider the chart below:
Observing the ETHUSDT chart, the 20 TEMA crossed above the 50 TEMA which indicated the presence of buyers being in control of price. Following the subsequent development of price, the uptrend was maintained with the formation of consistent higher highs and higher lows and price movement staying above the TRIMA line.
Sell TRIMA Crossover
When the TRIMA with a higher period (50) setting crosses above TRIMA with a smaller period (20) setting, it's considered a sell signal, hinting at sellers being in control of price movement. A sell trade can be executed after the crossover and price movement cross and trades below the TRIMA line. Consider the chart below:
Looking at the ETHUSDT chart, the 50 TEMA crossed above the 20 TEMA which indicated the presence of sellers being in control of price. Following the subsequent development of price, the downtrend was maintained with the formation of consistent lower highs and lower lows and price movement staying below the TRIMA line.
Question 6
What are the conditions that must be satisfied to trade reversals using TRIMA combining RSI? Show the chart analysis. What other momentum indicators can be used to confirm TRIMA crossovers? Show examples on the chart. (Screenshots required).
Trend Reversal Using TRIMA Indicator
Reversal trading with the TRIMA indicator requires certain conditions are to be satisfied before a trade can be executed or exited. For this demonstration, I chose the TRIMA crossover strategy and some of the conditions include:
Bullish Trend Reversal Criteria using TRIMA Indicator
For a bullish trend reversal trade, the following conditions must be satisfied:
Add the two TRIMA indicators to the price chart with different period settings.
Following a downtrend move, wait for a crossover of the smaller period TRIMA above the higher period TRIMA. This indicates the presence of buyers being in control of price.
After the crossover, wait for the price to break above the TRIMA and use at least two candlesticks (bullish candlestick) confirmations.
The buy trade can be exited when the price approach a resistance level along the TRIMA line. Take profit and stop loss should be added in ratios of at least 1:1 to ensure a positive trade balance is maintained.
Consider the chart illustration below:
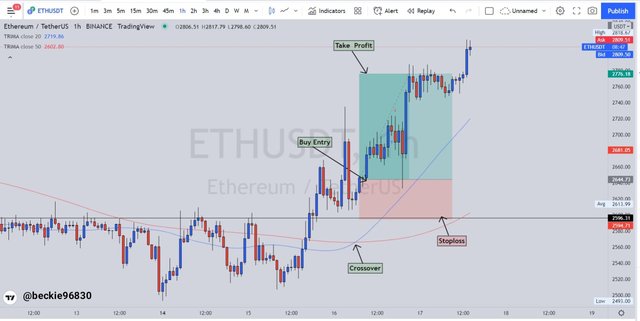
Observing the chart, following the bearish move, a crossover of the smaller TRIMA period above the higher period TRIMA was encountered, this was preceded by price movement breaking above the TRIMA lines, which confirmed the presence of buyers being in control of price. A buy trade can be executed after two bullish candles confirmation with stoploss placed below the previous low and take profit targeting the nearest resistance.
Bearish Trend Reversal Criteria Using TRIMA indicator
For a bearish trend reversal trade, the following conditions must be satisfied:
Add the two TRIMA indicators to the price chart with different period settings.
Following an uptrend move, wait for a crossover of the higher period TRIMA above the smaller period TRIMA. This indicates the presence of sellers being in control of price.
After the crossover, wait for the price to break below the TRIMA and use at least two candlesticks (bearish candlestick) confirmations.
The sell trade can be exited when the price approach a support level along the TRIMA line. Take profit and stop loss should be added in ratios of at least 1:1 to ensure a positive trade balance is maintained.
Consider the chart illustration below:
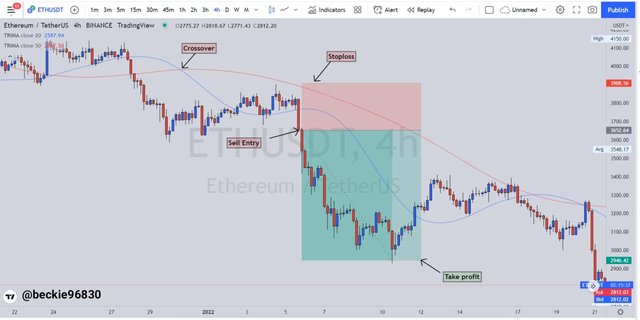
Observing the chart, following the bullish move, a crossover of the higher TRIMA period above the smaller period TRIMA was encountered, and this was preceded by price movement breaking below the TRIMA lines, this confirmed the presence of sellers being in control of price. A sell trade can be executed after two bearish candles confirmation with stoploss placed above the previous high and take profit targeting the nearest support.
RSI and TEMA Indicator
The RSI is a momentum-based indicator that indicates the condition of a given market in terms of overbought, oversold, or balanced market. This is done with the RSI levels of 30 and 70. Ideally, when the price moves below the 30 RSI level, it's considered that the market is in an oversold state and a possible bullish reversal signal. While a move above the 70 RSI level indicates that the market is in an overbought state and a possible bearish reversal signal.
To combine the RSI and TRIMA, the two indicators must satisfy the conditions for a crossover and corresponding market conditions state.
In an uptrend, the RSI indicator should indicate that the price is in an oversold condition with its movement below the 30 level. Similarly, the TRIMA crossover should confirm the bullish sentiment with the cross of the shorter period TRIMA line above the longer period TRIMA line. Observe the chart below:
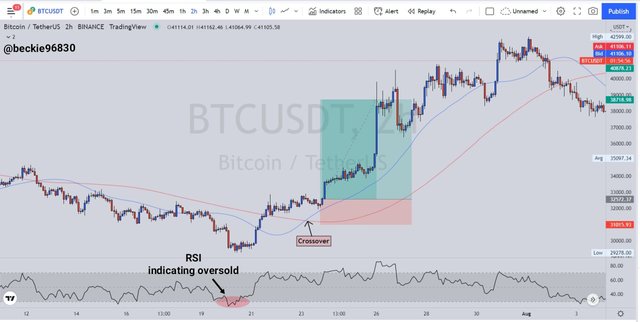
From the chart above, the crossover of the 20 TRIMA above the 50 TRIMA indicated the presence of buyers being in control of price. the RSI correlated with the sentiment, with its movement crossing below the 30 level, which indicates an oversold condition and a possible bullish trend reversal should be anticipated as the buying momentum is increasing. A buy trade can be executed as the two indicators confirm the bullishness of price.
Similarly, during a downtrend, the RSI indicator should indicate that the price is in an overbought condition with its movement above the 70 level. Similarly, the TRIMA crossover should confirm the bullish sentiment with the cross of the longer period TRIMA line above the shorter period TRIMA line. Observe the chart below:
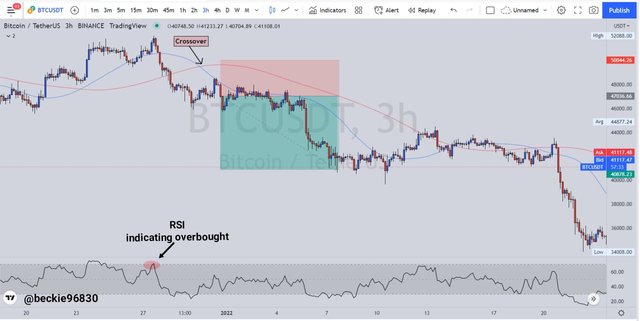
Observing the chart above, the crossover of the 50 TRIMA line above the 20 TRIMA line indicated the presence of sellers being in control of price. the RSI indicator correlated with this sentiment, with its movement breaking above the 70 level, which indicates an overbought condition. A possible bearish trend reversal should be anticipated as the selling momentum is increasing. A sell trade can be executed as the two indicators confirm the bearishness of the price.
Question 7
Place a Demo and Real trade using the TRIMA reversal trading strategy (combine RSI). Ideally, bullish and bearish reversals. Utilize lower time frames with proper risk management. (Screenshots required).
1- Demo Trade (BUY Trade) ETHUSDT 1 MIN
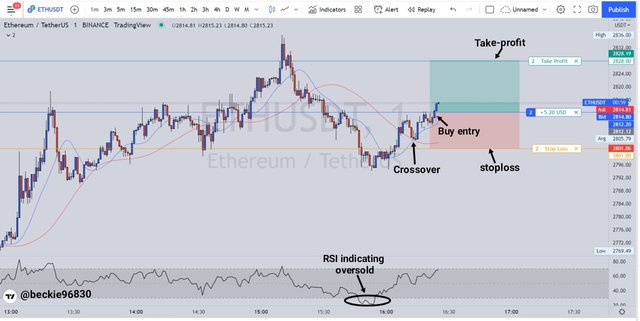
Observing the chart above, a crossover of the 20 TRIMA line above the 50 TRIMA line, indicated the presence of buyers being in control of price. the RSI correlated with the sentiment with its movement crossing below the 30 level, which indicates an oversold condition and a possible bullish trend reversal should be anticipated as the buying momentum is increasing.
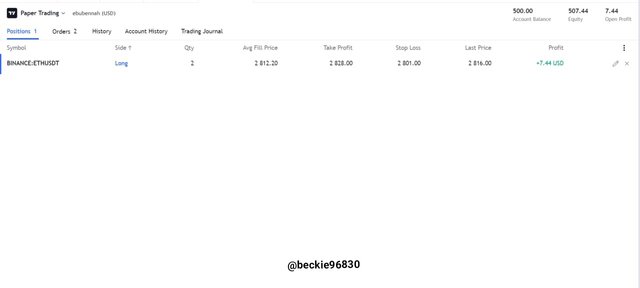
I executed a buy trade order in my paper trading account at $2,812.12, with stoploss placed at $2,801.00 and take Profit placed at $2,828.19. The risk to reward on the trade was in a ratio of 1:1.7 RR.
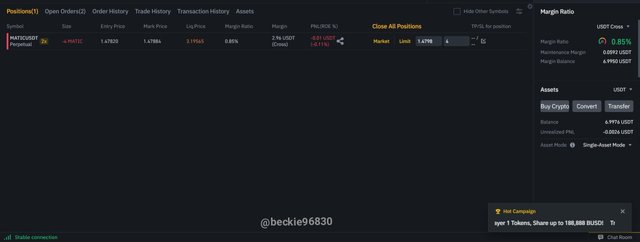
2- Real Trade (SELL Trade) MATICUSDT 3 MINS
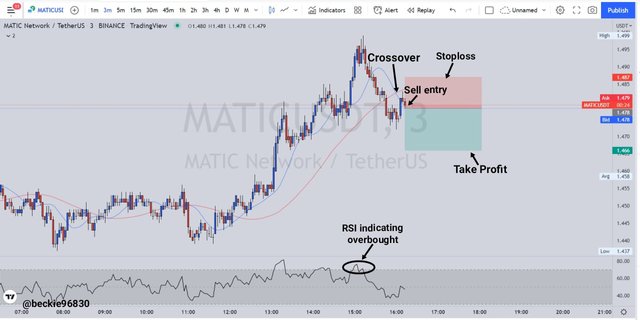
Looking at the chart above, the crossover of the 50 TRIMA line above the 20 TRIMA line indicated the presence of sellers being in control of price. the RSI indicator correlated with this sentiment, with its movement breaking above the 70 level, which indicates an overbought condition. A possible bearish trend reversal should be anticipated as the selling momentum is increasing.
I executed a sell trade order in my exchange account at $1.47820, with stoploss placed at $1.48700 and take Profit placed at $1.46600. The risk to reward on the trade was executed at ratios of 1:1 RR. I executed the trade via futures margin trading on my verified binance exchange account, using the leverage of 2x.
After a period of waiting, I observed that the preceding development of price moved in the intended direction. Price eventually moved into profit.
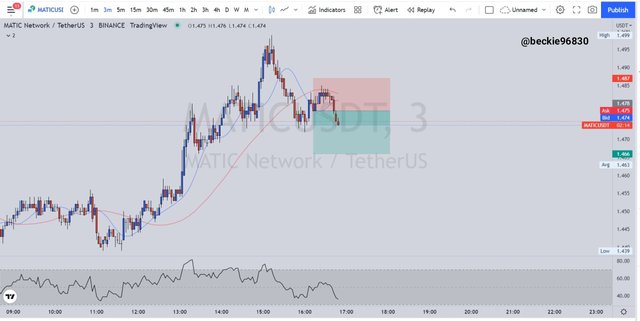
I secured the entire position when the price approached and reacted around a minor resistance level. I closed the trade position with a 0.68% profit.

Question 8
What are the advantages and disadvantages of TRIMA Indicator?
Advantages of TRIMA
The TRIMA indicator has notable advantages which include:
The TRIMA indicator smooth price representation thus removing noise and distorted trade signal.
The TRIMA indicator identifies dynamic support and resistance levels following the further development of price movement. This helps traders identify entry and exit points when trading.
The TRIMA indicates buying and selling opportunities with its crossover strategy, where two TRIMA indicators with a different period are combined to generate a trade signal.
The TRIMA indicator represents price changes similar to other moving averages, where trends are identified with the angle of the indicator line upward or downward, making it relatively easy to use and understand.
Disadvantages of TRIMA Indicator
The TRIMA indicator has notable disadvantages which include :
The TRIMA indicator is only useful in trending market conditions. In the absence of a trending market structure, the TRIMA often generates distorted trade signals.
The TRIMA indicator require to be combined with other indicators like RSI, volume, MACD, etc. to function effectively thus filtering out noise and generating clear trade signals.
The TRIMA indicator dynamic resistance and support level can easily be swapped because of how gats it reacts to price. For instance, taking a sell position after a break below the TRIMA line serves as dynamic resistance, then the next candle closes back above the TRIMA line.
Conclusion
The TRIMA indicator works by applying a double smoothing function generated from its calculation to its simple moving average values. This function ensures that lags and random price fluctuation are ignored by the TRIMA indicator, and this results in a smoothened representation of the indicator data in relation to price movement, making the TRIMA an ultimate choice in identifying trends, trend structure, support, and resistance areas using the average indicator. The TRIMA indicator should be combined with other indicators to generate reliable trade signals, as no trading indicator is 100% efficient.
Thank you professor @fredquantum for this educative and insightful lesson.
Wonderful post. Lengthy, well constructed, and very informative. I haven't heard of the TRIMA indicator before -- though I will most certainly give it a shot after reading your oped.
Keep up the great work!